
画布中沿曲线的梯度笔画
画布中沿曲线的梯度笔画
提问于 2014-06-04 00:22:03
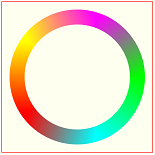
我试着在画布上画一条曲线,在曲线上画一个线性渐变的曲线,就像在this image中一样。在那个页面上有一个链接的svg文件,它给出了如何在svg中实现效果的说明。也许类似的方法在画布上也是可能的?
Stack Overflow用户
回答已采纳
发布于 2014-06-04 05:25:44
演示:http://jsfiddle.net/m1erickson/4fX5D/
很容易创建一个沿路径()改变的梯度
创建一个跨路径的渐变会更加困难
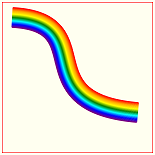
要创建跨路径的渐变,可以绘制多条与路径相切的渐变线:
如果你画了足够多的切线,那么眼睛就会看到这条曲线是路径上的一个梯度。
注意:锯齿可能发生在路径梯度的外部.这是因为梯度实际上是由数百条切线组成的。但是你可以通过使用适当的颜色在渐变的两边画一条线来平滑锯齿(在这里,反锯齿线在顶部是红色的,在底部是紫色的)。
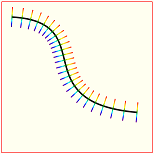
下面是跨路径创建梯度的步骤
- 沿着这条路划出几百个点。
- 计算路径在这些点的角度。
- 在每个点上,创建一个线性梯度,并在该点的切线上画一条梯度抚摸线。是的,你必须为每个点创建一个新的梯度,因为线性梯度必须与直线切线到那个点的角度相匹配。
- 为了减少绘制多条单独的线条所造成的锯齿效应,您可以沿着渐变路径的顶部和底部绘制一条平滑的路径来覆盖锯齿。
下面是带注释的代码:
<!doctype html>
<html>
<head>
<link rel="stylesheet" type="text/css" media="all" href="css/reset.css" /> <!-- reset css -->
<script type="text/javascript" src="http://code.jquery.com/jquery.min.js"></script>
<style>
    body{ background-color: ivory; }
    #canvas{border:1px solid red;}
</style>
<script>
$(function(){

    // canvas related variables
    var canvas=document.getElementById("canvas");
    var ctx=canvas.getContext("2d");

    // variables defining a cubic bezier curve
    var PI2=Math.PI*2;
    var s={x:20,y:30};
    var c1={x:200,y:40};
    var c2={x:40,y:200};
    var e={x:270,y:220};

    // an array of points plotted along the bezier curve
    var points=[];

    // we use PI often so put it in a variable
    var PI=Math.PI;

    // plot 400 points along the curve
    // and also calculate the angle of the curve at that point
    for(var t=0;t<=100;t+=0.25){

        var T=t/100;

        // plot a point on the curve
        var pos=getCubicBezierXYatT(s,c1,c2,e,T);

        // calculate the tangent angle of the curve at that point
        var tx = bezierTangent(s.x,c1.x,c2.x,e.x,T);
        var ty = bezierTangent(s.y,c1.y,c2.y,e.y,T);
        var a = Math.atan2(ty, tx)-PI/2;

        // save the x/y position of the point and the tangent angle
        // in the points array
        points.push({
            x:pos.x,
            y:pos.y,
            angle:a
        });

    }


    // Note: increase the lineWidth if
    // the gradient has noticable gaps
    ctx.lineWidth=2;

    // draw a gradient-stroked line tangent to each point on the curve
    for(var i=0;i<points.length;i++){

        // calc the topside and bottomside points of the tangent line
        var offX1=points[i].x+20*Math.cos(points[i].angle);
        var offY1=points[i].y+20*Math.sin(points[i].angle);
        var offX2=points[i].x+20*Math.cos(points[i].angle-PI);
        var offY2=points[i].y+20*Math.sin(points[i].angle-PI);

        // create a gradient stretching between
        // the calculated top & bottom points
        var gradient=ctx.createLinearGradient(offX1,offY1,offX2,offY2);
        gradient.addColorStop(0.00, 'red');
        gradient.addColorStop(1/6, 'orange');
        gradient.addColorStop(2/6, 'yellow');
        gradient.addColorStop(3/6, 'green')
        gradient.addColorStop(4/6, 'aqua');
        gradient.addColorStop(5/6, 'blue');
        gradient.addColorStop(1.00, 'purple');

        // draw the gradient-stroked line at this point
        ctx.strokeStyle=gradient;
        ctx.beginPath();
        ctx.moveTo(offX1,offY1);
        ctx.lineTo(offX2,offY2);
        ctx.stroke();
    }


    // draw a top stroke to cover jaggies
    // on the top of the gradient curve
    var offX1=points[0].x+20*Math.cos(points[0].angle);
    var offY1=points[0].y+20*Math.sin(points[0].angle);
    ctx.strokeStyle="red";
    // Note: increase the lineWidth if this outside of the
    //       gradient still has jaggies
    ctx.lineWidth=1.5;
    ctx.beginPath();
    ctx.moveTo(offX1,offY1);
    for(var i=1;i<points.length;i++){
        var offX1=points[i].x+20*Math.cos(points[i].angle);
        var offY1=points[i].y+20*Math.sin(points[i].angle);
        ctx.lineTo(offX1,offY1);
    }
    ctx.stroke();


    // draw a bottom stroke to cover jaggies
    // on the bottom of the gradient
    var offX2=points[0].x+20*Math.cos(points[0].angle+PI);
    var offY2=points[0].y+20*Math.sin(points[0].angle+PI);
    ctx.strokeStyle="purple";
    // Note: increase the lineWidth if this outside of the
    //       gradient still has jaggies
    ctx.lineWidth=1.5;
    ctx.beginPath();
    ctx.moveTo(offX2,offY2);
    for(var i=0;i<points.length;i++){
        var offX2=points[i].x+20*Math.cos(points[i].angle+PI);
        var offY2=points[i].y+20*Math.sin(points[i].angle+PI);
        ctx.lineTo(offX2,offY2);
    }
    ctx.stroke();


    //////////////////////////////////////////
    // helper functions
    //////////////////////////////////////////

    // calculate one XY point along Cubic Bezier at interval T
    // (where T==0.00 at the start of the curve and T==1.00 at the end)
    function getCubicBezierXYatT(startPt,controlPt1,controlPt2,endPt,T){
        var x=CubicN(T,startPt.x,controlPt1.x,controlPt2.x,endPt.x);
        var y=CubicN(T,startPt.y,controlPt1.y,controlPt2.y,endPt.y);
        return({x:x,y:y});
    }

    // cubic helper formula at T distance
    function CubicN(T, a,b,c,d) {
        var t2 = T * T;
        var t3 = t2 * T;
        return a + (-a * 3 + T * (3 * a - a * T)) * T
        + (3 * b + T * (-6 * b + b * 3 * T)) * T
        + (c * 3 - c * 3 * T) * t2
        + d * t3;
    }

    // calculate the tangent angle at interval T on the curve
    function bezierTangent(a, b, c, d, t) {
        return (3 * t * t * (-a + 3 * b - 3 * c + d) + 6 * t * (a - 2 * b + c) + 3 * (-a + b));
    };

}); // end $(function(){});
</script>
</head>
<body>
    <canvas id="canvas" width=300 height=300></canvas>
</body>
</html>页面原文内容由Stack Overflow提供。腾讯云小微IT领域专用引擎提供翻译支持
原文链接:
https://stackoverflow.com/questions/24027087
复制相关文章
相似问题
腾讯云开发者
