
如何将脑电数据呈现到HTML5中?
如何将脑电数据呈现到HTML5中?
提问于 2014-06-11 15:02:58
是否有任何方法可以通过使用画布或其他软件包将脑电数据提供给HTML5?或者有什么API可以将脑电数据输入到HTML5中?
任何建议..。
回答 1
Stack Overflow用户
回答已采纳
发布于 2014-06-11 15:29:34
下面是一个开始的示例,绘制一个波浪形式供您学习。
演示:http://jsfiddle.net/m1erickson/4xMtc/
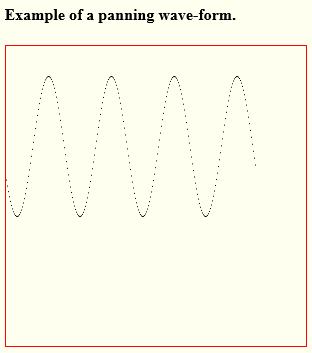
画布平底的屏幕总是显示最新的领先数据。
这个例子使用一个简单的正弦波,但是你可以把你的脑电图插入data[]阵列,然后你的脑电信号就会画出来。
<!doctype html>
<html>
<head>
<link rel="stylesheet" type="text/css" media="all" href="css/reset.css" /> <!-- reset css -->
<script type="text/javascript" src="http://code.jquery.com/jquery.min.js"></script>
<style>
    body{ background-color: ivory; }
    #canvas{border:1px solid red;}
</style>
<script>
$(function(){

    var canvas=document.getElementById("canvas");
    var ctx=canvas.getContext("2d");

    // capture incoming socket data in an array
    var data=[];

    // TESTING: fill data with some test values
    for(var i=0;i<5000;i++){
        data.push(Math.sin(i/10)*70+100);
    }

    // x is your most recent data-point in data[]
    var x=0;

    // panAtX is how far the plot will go rightward on the canvas
    // until the canvas is panned

    var panAtX=250;

    var continueAnimation=true;
    animate();


    function animate(){

        if(x>data.length-1){return;}

        if(continueAnimation){
            requestAnimationFrame(animate);
        }

        if(x++<panAtX){

            ctx.fillRect(x,data[x],1,1);

        }else{

            ctx.clearRect(0,0,canvas.width,canvas.height);

            // plot data[] from x-PanAtX to x

            for(var xx=0;xx<panAtX;xx++){
                var y=data[x-panAtX+xx];
                ctx.fillRect(xx,y,1,1)
            }
        }
    }


}); // end $(function(){});
</script>
</head>
<body>
    <canvas id="canvas" width=300 height=300></canvas>
</body>
</html>页面原文内容由Stack Overflow提供。腾讯云小微IT领域专用引擎提供翻译支持
原文链接:
https://stackoverflow.com/questions/24166325
复制相关文章
相似问题
腾讯云开发者
