
如何在LineSeries图表上绘制多个OxyPlot?
我很抱歉问了这么多OxyPlot问题,但我似乎真的很难使用OxyPlot图表控件。
我的项目是WPF格式的,所以我最初使用的是一个托管的WINFORMS图表,它工作起来很有魅力,并且做了我需要做的一切,直到我需要在托管的winform图表上覆盖一个WPF元素。由于"AirSpace“问题,无论我做了什么,我都无法看到放在托管图表上的WPF元素。就在那时,我决定使用OxyPlot,到目前为止,这让我头痛不已。
这是我的原问题!这是我在CodePlex问的。我似乎没有得到太多的帮助,所以我在这里再次尝试。
我的问题是:
有人知道如何将多个LineSeries绘制到一个图上吗?
到目前为止,我的方法:
我使用一个c#列表数组,并添加一个新的LineSeries副本,该副本保存要绘制的新数据。我的代码:
    // Function to plot data
    private void plotData(double numWeeks, double startingSS)
    {

        // Initialize new Salt Split class for acess to data variables
        Salt_Split_Builder calcSS = new Salt_Split_Builder();
        calcSS.compute(numWeeks, startingSS, maxDegSS);

        // Create the OxyPlot graph for Salt Split
        OxyPlot.Wpf.PlotView plot = new OxyPlot.Wpf.PlotView();

        var model = new PlotModel();

        // Add Chart Title
        model.Title = "Salt Split Degradation";

        // Create new Line Series
        LineSeries linePoints = new LineSeries() { StrokeThickness = 1, MarkerSize = 1, Title = numWeeks.ToString() + " weeks" };

        // Add each point to the new series
        foreach (var point in calcSS.saltSplitCurve)
        {
            DataPoint XYpoint = new DataPoint();
            XYpoint = new DataPoint(point.Key, point.Value * 100);
            linePoints.Format("%", XYpoint.Y);
            linePoints.Points.Add(XYpoint);
        }

        listPointAray.Add(linePoints);

        // Define X-Axis
        var Xaxis = new OxyPlot.Axes.LinearAxis();
        Xaxis.Maximum = numWeeks;
        Xaxis.Minimum = 0;
        Xaxis.Position = OxyPlot.Axes.AxisPosition.Bottom;
        Xaxis.Title = "Number of Weeks";
        model.Axes.Add(Xaxis);

        //Define Y-Axis
        var Yaxis = new OxyPlot.Axes.LinearAxis();
        Yaxis.MajorStep = 15;
        Yaxis.Maximum = calcSS.saltSplitCurve.Last().Value * 100;
        Yaxis.MaximumPadding = 0;
        Yaxis.Minimum = 0;
        Yaxis.MinimumPadding = 0;
        Yaxis.MinorStep = 5;
        Yaxis.Title = "Percent Degradation";
        model.Axes.Add(Yaxis);

        // Add Each series to the
        foreach (var series in listPointAray)
        {
            LineSeries newpoints = new LineSeries();
            newpoints = linePoints;
            model.Series.Add(newpoints);
        }

        // Add the plot to the window
        plot.Model = model;
        SaltSplitChartGrid.Children.Add(plot);

    }
我的代码在第一次按下“图形数据”按钮时工作正常,但在连续尝试时失败,出现以下错误:
元素无法添加,它已经属于一个绘图模型
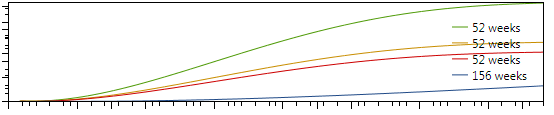
下面的绘图是我想要生成的绘图类型(使用WinForms图表控件工作得很好):

我希望每次运行该方法时,都要绘制一条新的线条,并画出新的颜色。
回答 3
Stack Overflow用户
发布于 2014-07-24 19:40:40
成功!
AwkwardCoder,谢谢你的帮助,但我意识到我的错误只是我忽略了一些事情!
下面是工作的代码的版本:
        // Make a new plotmodel
    private PlotModel model = new PlotModel();

    // Create the OxyPlot graph for Salt Split
    private OxyPlot.Wpf.PlotView plot = new OxyPlot.Wpf.PlotView();

    // Function to plot data
    private void plotData(double numWeeks, double startingSS)
    {
        List<LineSeries> listPointAray = new List<LineSeries>();

        // Initialize new Salt Split class for acess to data variables
        Salt_Split_Builder calcSS = new Salt_Split_Builder();
        calcSS.compute(numWeeks, startingSS, maxDegSS);

        // Create new Line Series
        LineSeries linePoints = new LineSeries()
        { StrokeThickness = 1, MarkerSize = 1, Title = numWeeks.ToString() + " weeks" };


        // Add each point to the new series
        foreach (var point in calcSS.saltSplitCurve)
        {
            DataPoint XYpoint = new DataPoint();
            XYpoint = new DataPoint(point.Key, point.Value * 100);
            linePoints.Format("%", XYpoint.Y);
            linePoints.Points.Add(XYpoint);
        }

        listPointAray.Add(linePoints);

        // Add Chart Title
        model.Title = "Salt Split Degradation";

        // Add Each series to the
        foreach (var series in listPointAray)
        {
            // Define X-Axis
            OxyPlot.Axes.LinearAxis Xaxis = new OxyPlot.Axes.LinearAxis();
            Xaxis.Maximum = numWeeks;
            Xaxis.Minimum = 0;
            Xaxis.Position = OxyPlot.Axes.AxisPosition.Bottom;
            Xaxis.Title = "Number of Weeks";
            model.Axes.Add(Xaxis);

            //Define Y-Axis
            OxyPlot.Axes.LinearAxis Yaxis = new OxyPlot.Axes.LinearAxis();
            Yaxis.MajorStep = 15;
            Yaxis.Maximum = calcSS.saltSplitCurve.Last().Value * 100;
            Yaxis.MaximumPadding = 0;
            Yaxis.Minimum = 0;
            Yaxis.MinimumPadding = 0;
            Yaxis.MinorStep = 5;
            Yaxis.Title = "Percent Degradation";
            //Yaxis.StringFormat = "{0.00} %";
            model.Axes.Add(Yaxis);

            model.Series.Add(series);
        }


        // Add the plot to the window

        plot.Model = model;
        plot.InvalidatePlot(true);
        SaltSplitChartGrid.Children.Clear();
        SaltSplitChartGrid.Children.Add(plot);

    }
以下是我做错的多件事:
- 在我的foreach系列循环中,我添加了已经添加的原始序列,而不是列表中的下一个var系列!(哑巴!)
- 每次运行该方法时,我都会创建一个新模型。这意味着每次代码运行时,我都会添加一个已经存在于前一个模型中的系列。(也很蠢!)
- 我每次都在创建一个新的地块,并试图在新的地块中添加一个模型,这个模型已经属于以前的一个情节了。(弄假人.)
- 每次我运行该方法时,都会将该图添加到网格中,因此,在重新添加相同的绘图之前,我必须先清除网格的子节点。
- 我不是在刷新情节。
这是很多错误,但我努力克服了它。希望这能对未来的人有所帮助。而且,我知道我没有使用普通的数据绑定技术,但至少,这是可行的。
最终结果:
Stack Overflow用户
发布于 2014-07-24 16:15:59
这是我以前如何在OxyPlot图表上创建多行代码的,关键是为每个系列创建一组DataPoints --在下面的示例代码中称为circlePoints & linePoints,然后将它们绑定到CircleSeries和LineSeries:
var xAxis = new DateTimeAxis
{
    Position = AxisPosition.Bottom,
    StringFormat = Constants.MarketData.DisplayDateFormat,
    Title = "End of Day",
    IntervalLength = 75,
    MinorIntervalType = DateTimeIntervalType.Days,
    IntervalType = DateTimeIntervalType.Days,
    MajorGridlineStyle = LineStyle.Solid,
    MinorGridlineStyle = LineStyle.None,
};

var yAxis = new LinearAxis
{
    Position = AxisPosition.Left,
    Title = "Value",
    MajorGridlineStyle = LineStyle.Solid,
    MinorGridlineStyle = LineStyle.None
};

var plot = new PlotModel();
plot.Axes.Add(xAxis);
plot.Axes.Add(yAxis);

var circlePoints = new[]
{
    new ScatterPoint(DateTimeAxis.ToDouble(date1), value1),
    new ScatterPoint(DateTimeAxis.ToDouble(date2), value2),
};

var circleSeries =  new ScatterSeries
{
    MarkerSize = 7,
    MarkerType = MarkerType.Circle,
    ItemsSource = circlePoints
};

var linePoints = new[]
{
    new DataPoint(DateTimeAxis.ToDouble(date1), value1),
    new DataPoint(DateTimeAxis.ToDouble(date2), value2),
};

var lineSeries = new LineSeries
{
    StrokeThickness = 2,
    Color = LineDataPointColor,
    ItemsSource = linePoints
};

plot.Series.Add(circleSeries);
plot.Series.Add(lineSeries);Stack Overflow用户
发布于 2020-03-10 02:48:49
下面是如何在XAML中实现类似的结果,特别是在使用MVVM方法的情况下。
ViewModel:
public ObservableCollection<DataPoint> DataPointList1 {get;set;}
public ObservableCollection<DataPoint> DataPointList2 {get;set;}
public ObservableCollection<DataPoint> DataPointList3 {get;set;}
public ObservableCollection<DataPoint> DataPointList4 {get;set;}
使用下面这样的for循环可以使用适当的数据集将DataPointList1填充到DataPointList4。
for (int i = 0; i < dataList.Count; i++)
{
    DataPointList1 .Add(new DataPoint{dataList[i].XValue,dataList[i].YValue });
}
XAML:
    xmlns:oxy="http://oxyplot.org/wpf"

<oxy:Plot LegendPlacement="Outside" LegendPosition="RightMiddle" Title="Your Chart Title" >
    <oxy:Plot.Axes>
        <oxy:LinearAxis Title="Your X-axis Title" Position="Bottom" IsZoomEnabled="True" />
       <oxy:LinearAxis Title="Your Y-axis Title" Position="Left" IsZoomEnabled="True" />
  </oxy:Plot.Axes>
  <oxy:Plot.Series>
       <oxy:LineSeries Title="Plot1"  Color="Black"  ItemsSource="{Binding DataPointList1 }"/>
       <oxy:LineSeries Title="Plot2"  Color="Green"  ItemsSource="{Binding DataPointList2 }"/>
       <oxy:LineSeries Title="Plot3"  Color="Blue"   ItemsSource="{Binding DataPointList3 }"/>
       <oxy:LineSeries Title="Plot4"  Color="Red" ItemsSource="{Binding DataPointList4 }"/>
   </oxy:Plot.Series>
</oxy:Plot>https://stackoverflow.com/questions/24938689
复制相似问题
腾讯云开发者

Copyright © 2013 - 2026 Tencent Cloud. All Rights Reserved. 腾讯云 版权所有
深圳市腾讯计算机系统有限公司 ICP备案/许可证号:粤B2-20090059 ![]() 粤公网安备44030502008569号
粤公网安备44030502008569号
腾讯云计算(北京)有限责任公司 京ICP证150476号 | 京ICP备11018762号