
ggplot2:如何获得facet_grid()的labeller=label_both和facet_wrap()的ncol选项的合并功能?
ggplot2:如何获得facet_grid()的labeller=label_both和facet_wrap()的ncol选项的合并功能?
提问于 2014-08-01 16:18:51
我正在使用ggplot2创建一个盒图。我能够成功地创建盒图,但是当将ggplot2中的两个特性与faceting合并时,我遇到了问题:
- 在切面时,条形文本应该包含列名&列值(如labeller=label_both参数在
facet_grid()中提供的那样)。 - 这些面应该被分割成任意数量的行&列,就像我想要的那样(如
facet_wrap()中的nrow和ncol参数所提供的)。
下面是我的dataframe的一个子集(实际的dataframe相当大):
>tmpdf

    value  treat FoldChange Gene Pvalue.Adj
 523.8589 Normal     -1.899    A    0.02828
 489.7638 Normal     -1.899    A    0.02828
 642.0126 Cancer     -1.899    A    0.02828
 928.8136 Cancer     -1.899    A    0.02828
 624.7892 Normal     -1.899    A    0.02828
  53.8685 Normal     -7.135    B    0.00012
 184.6473 Normal     -7.135    B    0.00012
  76.2712 Cancer     -7.135    B    0.00012
  48.0607 Cancer     -7.135    B    0.00012
 177.9528 Normal     -7.135    B    0.00012
4581.2847 Normal     -1.886    C    0.04924
7711.3411 Normal     -1.886    C    0.04924
6007.9852 Cancer     -1.886    C    0.04924
5940.9232 Cancer     -1.886    C    0.04924
4433.0949 Normal     -1.886    C    0.04924
 171.9172 Normal     -4.594    D    0.00093
 316.3900 Cancer     -4.594    D    0.00093
 231.3177 Cancer     -4.594    D    0.00093
 295.1096 Normal     -4.594    D    0.00093
 322.8346 Normal     -4.594    D    0.00093
这是我的密码:
#Here I am using facet_grid and labeller=label_both, this gives me column names & column values in the facet strip text but I am unable to divide the plot into columns & rows.

ggplot(tmpdf,aes(x=treat,y=log(value+1),fill=treat)) + geom_boxplot(show_guide=F) +
facet_grid(~Gene+FoldChange+Pvalue.Adj,labeller=label_both) + ylab("log2(Expression)\n") +
ggtitle("Boxplot with facet_grid & labeller\n\nlabeller=label_both shows column names with column values\n") +
theme(axis.text.x=element_text(size=14,color="black"),
    axis.text.y=element_text(size=14,color="black"),
    strip.text=element_text(size=14,color="black"),
    axis.title.x=element_blank(),
    axis.title.y=element_text(size=14,color="black"),
    plot.title=element_text(size=16,color="black"))

#This creates the following plot:

#And here is the second code:
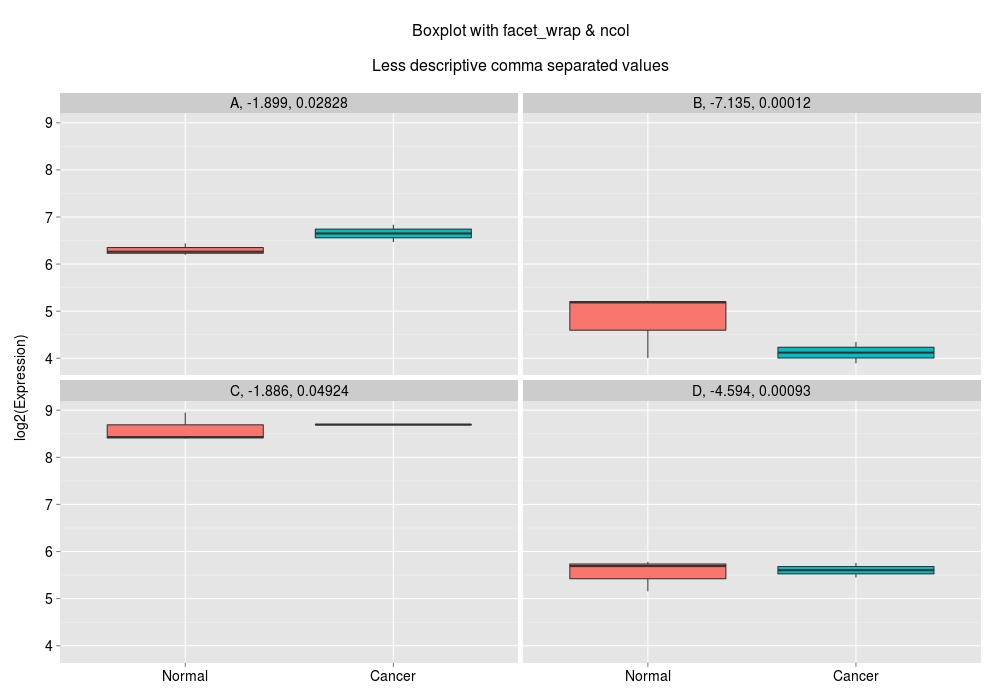
#This divides the plot into as many columns as I want but doesn't show the column name in the facet strip text.
#Strip text contains comma-separated values that are less informative.
ggplot(tmpdf,aes(x=treat,y=log(value+1),fill=treat)) + geom_boxplot(show_guide=F) +
facet_wrap(~Gene+FoldChange+Pvalue.Adj,ncol=2) + ylab("log2(Expression)\n") +
ggtitle("Boxplot with facet_wrap & ncol\n\nDoesn't show column name\n") +
theme(axis.text.x=element_text(size=14,color="black"),
axis.text.y=element_text(size=14,color="black"),
strip.text=element_text(size=14,color="black"),
axis.title.x=element_blank(),
axis.title.y=element_text(size=14,color="black"),
plot.title=element_text(size=16,color="black"))
#This creates the following plot:
如何将我的绘图分割成多个列/行,以及如何在方面中有一个包含列名和值的描述性条形文本?
Stack Overflow用户
回答已采纳
发布于 2014-08-01 18:33:59
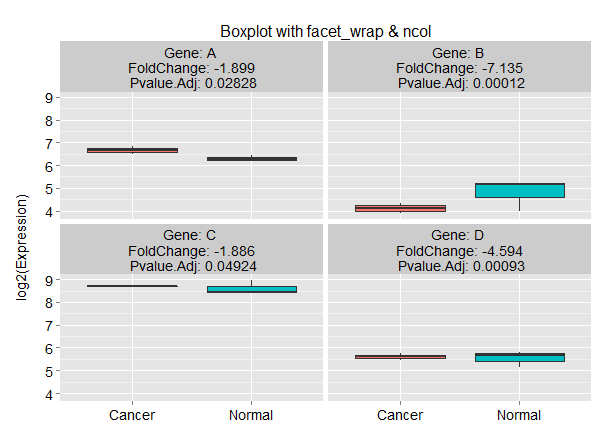
这是一个小黑客,但它似乎提供了你想要的东西。
tmpdf$label <- with(tmpdf,paste("Gene:",Gene,"\n","FoldChange:",FoldChange,"\n","Pvalue.Adj:",Pvalue.Adj))

ggplot(tmpdf,aes(x=treat,y=log(value+1),fill=treat)) + geom_boxplot(show_guide=F) +
  facet_wrap(~label,ncol=2) + ylab("log2(Expression)\n") +
  ggtitle("Boxplot with facet_wrap & ncol") +
  theme(axis.text.x=element_text(size=14,color="black"),
        axis.text.y=element_text(size=14,color="black"),
        strip.text=element_text(size=14,color="black"),
        axis.title.x=element_blank(),
        axis.title.y=element_text(size=14,color="black"),
        plot.title=element_text(size=16,color="black"))
页面原文内容由Stack Overflow提供。腾讯云小微IT领域专用引擎提供翻译支持
原文链接:
https://stackoverflow.com/questions/25084558
复制相关文章
相似问题
腾讯云开发者
