
在python中使用iGraph进行社区检测,并将每个节点的社区编号写入CSV
在python中使用iGraph进行社区检测,并将每个节点的社区编号写入CSV
提问于 2014-08-11 23:47:20
我有一个网络,我想分析使用edge_betweenness社区检测算法在iGraph。我熟悉NetworkX,但我正在尝试学习iGraph,因为它是NetworkX上的额外社区检测方法。
我的最终目标是运行edge_betweenness社区检测,找到最佳的社区数量,并为图中的每个节点编写一个具有社区成员的CSV。
下面是我目前的代码。任何帮助,以了解社区的成员资格,是非常感谢的。
输入数据('network.txt'):
1 2
2 3
2 7
3 1
4 2
4 6
5 4
5 6
7 4
7 8
8 9
9 7
10 7
10 8
10 9
iGraph代码
import igraph
# load data into a graph
g = igraph.Graph.Read_Ncol('network.txt')
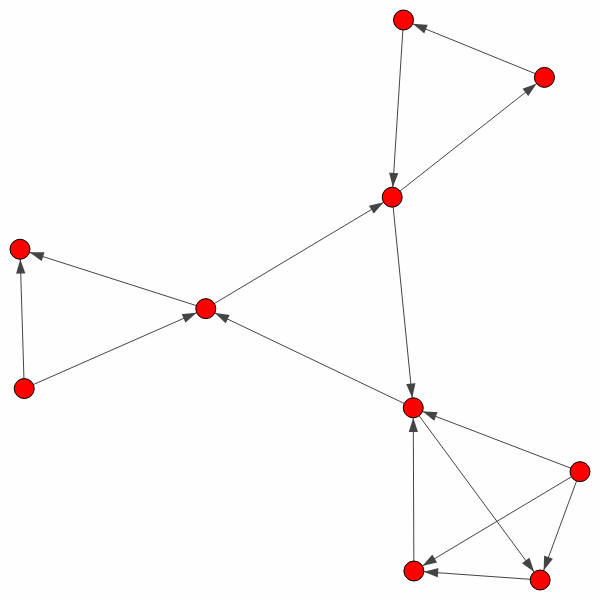
# plot graph
igraph.plot(g)
# identify communities
communities = igraph.community_edge_betweenness()

# not really sure what to do next
num_communities = communities.optimal_count
communities.as_clustering(num_communities)
,我需要做什么才能找到最佳的社区数量,并写出图中每个节点属于一个列表的社区呢?
回答 1
Stack Overflow用户
回答已采纳
发布于 2014-08-12 09:03:10
您正处于正确的轨道上;communities.optimal_count可以检索社区的最佳数量(“最优”定义为“最大模块化分数的社区数”),社区结构可以使用communities.as_clustering(num_communities)转换为一个平面的、不相交的聚类。实际上,如果社区数量恰好等于communities.optimal_count,则可以省略它。一旦这样做,就会得到一个具有membership属性的VertexClustering对象,该属性为图中的每个顶点提供集群索引。
为了清晰起见,我将您的communities变量重命名为dendrogram,因为社区间边缘检测算法实际上生成了一个树状图:
# calculate dendrogram
dendrogram = graph.community_edge_betweenness()
# convert it into a flat clustering
clusters = dendrogram.as_clustering()
# get the membership vector
membership = clusters.membership
现在,我们可以开始将成员向量和节点名称一起写入CSV文件::
import csv
from itertools import izip

writer = csv.writer(open("output.csv", "wb"))
for name, membership in izip(graph.vs["name"], membership):
writer.writerow([name, membership])如果您使用的是Python3,请使用zip而不是izip,并且不需要导入itertools。
页面原文内容由Stack Overflow提供。腾讯云小微IT领域专用引擎提供翻译支持
原文链接:
https://stackoverflow.com/questions/25254151
复制相关文章
相似问题
腾讯云开发者
