
从R中切割的树状图中提取标签的隶属度/分类(即:树状图的cutree函数)
我试图从R中的一个树状图中提取一个分类,我在一定高度上有cut。这在hclust对象上使用hclust很容易,但我不知道如何在dendrogram对象上这样做。
此外,我不能仅仅使用原来的hclust集群,因为(令人沮丧的),cutree类的编号与使用cut的类编号不同。
hc <- hclust(dist(USArrests), "ave")

classification<-cutree(hc,h=70)

dend1 <- as.dendrogram(hc)
dend2 <- cut(dend1, h = 70)


str(dend2$lower[[1]]) #group 1 here is not the same as
classification[classification==1] #group 1 here是否有一种方法可以使分类相互映射,或者从dendrogram对象中提取较低的分支成员(也许可以巧妙地使用dendrapply?)以一种更像cutree提供的格式?
回答 3
Stack Overflow用户
发布于 2014-08-25 19:00:27
我建议您使用来自cutree包的http://cran.r-project.org/web/packages/dendextend/函数。它包括一种树状图方法(即:dendextend:::cutree.dendrogram)。
您可以从开场白. 了解有关该包的更多信息。
我要补充的是,虽然您的函数(classify)很好,但是使用dendextend中的cutree有几个优点
- 它还允许您使用特定的
k(集群数量),而不仅仅是h(特定高度)。 - 这与从hclust上的cutree获得的结果是一致的(
classify不会)。 - 它通常会更快。
下面是使用代码的示例:
# Toy data:
hc <- hclust(dist(USArrests), "ave")
dend1 <- as.dendrogram(hc)

# Get the package:
install.packages("dendextend")
library(dendextend)

# Get the package:
cutree(dend1,h=70) # it now works on a dendrogram
# It is like using:
dendextend:::cutree.dendrogram(dend1,h=70)
顺便说一句,在这个函数的基础上,dendex趋向允许用户做更酷的事情,比如基于切割树状图的颜色分支/标签:
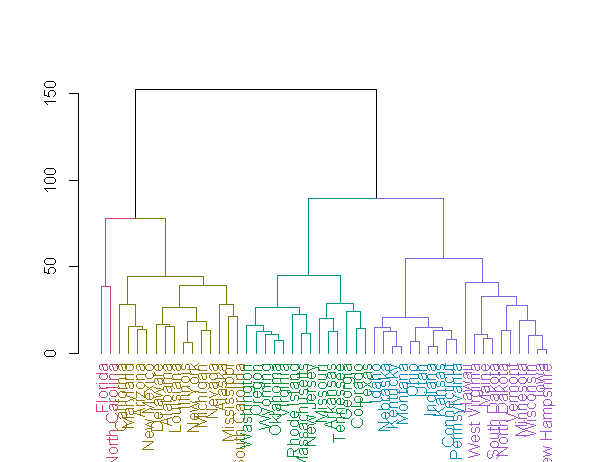
dend1 <- color_branches(dend1, k = 4)
dend1 <- color_labels(dend1, k = 5)
plot(dend1)
最后,以下是演示我的其他要点的更多代码:
# This would also work with k:
cutree(dend1,k=4)

# and would give identical result as cutree on hclust:
identical(cutree(hc,h=70)  , cutree(dend1,h=70)  )
   # TRUE

# But this is not the case for classify:
identical(classify(dend1,70)   , cutree(dend1,h=70)  )
   # FALSE


install.packages("microbenchmark")
require(microbenchmark)
microbenchmark(classify = classify(dend1,70),
               cutree = cutree(dend1,h=70)  )
#    Unit: milliseconds
#        expr      min       lq   median       uq       max neval
#    classify  9.70135  9.94604 10.25400 10.87552  80.82032   100
#      cutree 37.24264 37.97642 39.23095 43.21233 141.13880   100
# 4 times faster for this tree (it will be more for larger trees)

# Although (if to be exact about it) if I force cutree.dendrogram to not go through hclust (which can happen for "weird" trees), the speed will remain similar:
microbenchmark(classify = classify(dend1,70),
               cutree = cutree(dend1,h=70, try_cutree_hclust = FALSE)  )
# Unit: milliseconds
#        expr       min        lq    median       uq      max neval
#    classify  9.683433  9.819776  9.972077 10.48497 29.73285   100
#      cutree 10.275839 10.419181 10.540126 10.66863 16.54034   100
如果您正在考虑改进此功能的方法,请在此进行修补:
https://github.com/talgalili/dendextend/blob/master/R/cutree.dendrogram.R
我希望你,或其他人,会发现这个答案有帮助。
Stack Overflow用户
发布于 2014-08-25 16:20:56
最后,我创建了一个函数来使用dendrapply来完成它。它不雅致,但能用
classify <- function(dendrogram,height){

#mini-function to use with dendrapply to return tip labels
 members <- function(n) {
    labels<-c()
    if (is.leaf(n)) {
        a <- attributes(n)
        labels<-c(labels,a$label)
    }
    labels
 }

 dend2 <- cut(dendrogram,height) #the cut dendrogram object
 branchesvector<-c()
 membersvector<-c()

 for(i in 1:length(dend2$lower)){                             #for each lower tree resulting from the cut
  memlist <- unlist(dendrapply(dend2$lower[[i]],members))     #get the tip lables
  branchesvector <- c(branchesvector,rep(i,length(memlist)))  #add the lower tree identifier to a vector
  membersvector <- c(membersvector,memlist)                   #add the tip labels to a vector
 }
out<-as.integer(branchesvector)                               #make the output a list of named integers, to match cut() output
names(out)<-membersvector
out
}
使用该函数可以清楚地看出,问题是裁剪按字母顺序分配类别名称,而cutree则将分支名称从左到右分配。
hc <- hclust(dist(USArrests), "ave")
dend1 <- as.dendrogram(hc)

classify(dend1,70) #Florida 1, North Carolina 1, etc.
cutree(hc,h=70) #Alabama 1, Arizona 1, Arkansas 1, etc.Stack Overflow用户
发布于 2020-08-27 12:51:24
生成树状图后,使用cutree方法,然后将其转换为数据格式。下面的代码使用库密度绘制了一个很好的树状图:
library(dendextend)

# set the number of clusters
clust_k <- 8

# make the hierarchical clustering
par(mar = c(2.5, 0.5, 1.0, 7))
d <- dist(mat, method = "euclidean")
hc <- hclust(d)
dend <- d %>% hclust %>% as.dendrogram
labels_cex(dend) <- .65
dend %>%
  color_branches(k=clust_k) %>%
  color_labels() %>%
  highlight_branches_lwd(3) %>%
  plot(horiz=TRUE, main = "Branch (Distribution) Clusters by Heloc Attributes", axes = T)
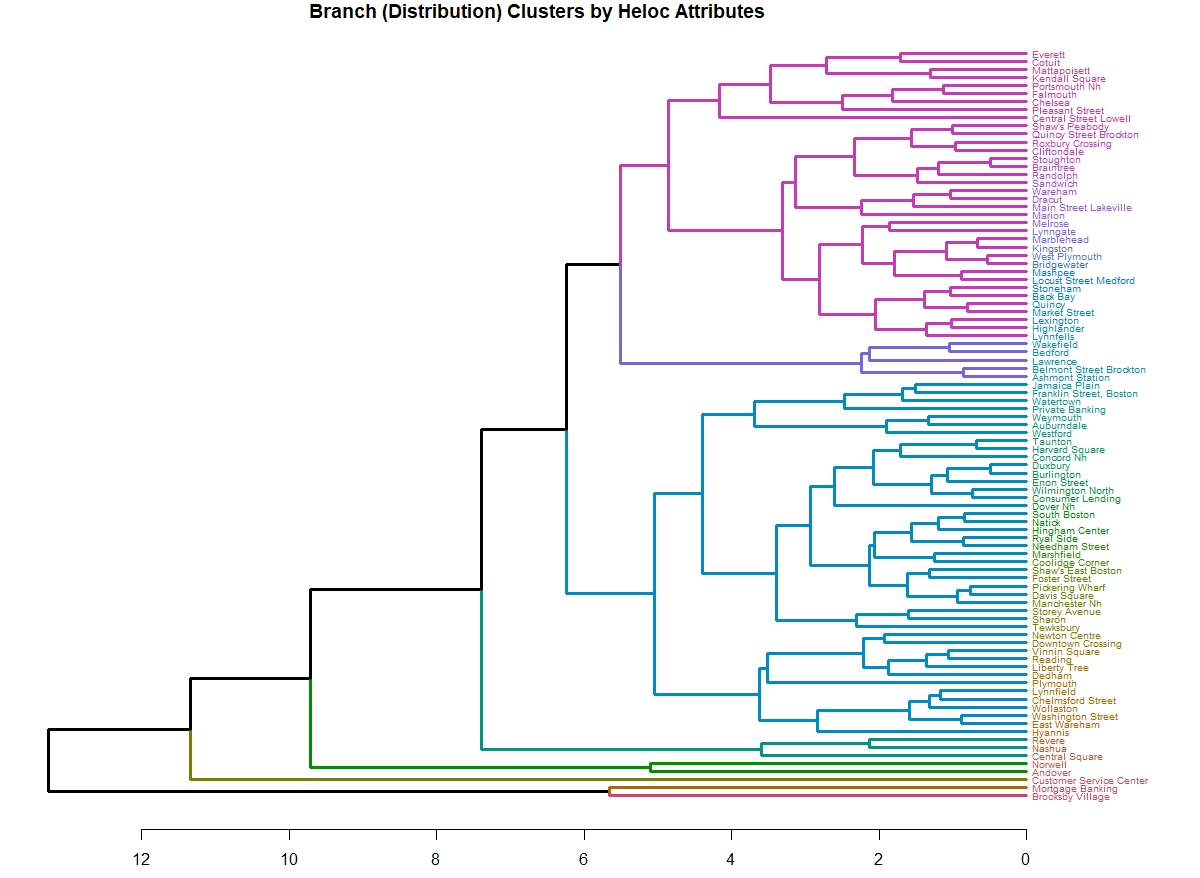
在着色方案的基础上,聚类似乎是在4的阈值附近形成的。因此,要将分配到数据中,我们需要得到这些簇,然后再对它们进行unlist()。
首先,您需要得到集群本身,但是,它只是数字的一个向量,行名是实际的标签。
# creates a single item vector of the clusters
myclusters <- cutree(dend, k=clust_k, h=4)

# make the dataframe of two columns cluster number and label
clusterDF <-  data.frame(Cluster = as.numeric(unlist(myclusters)),
                         Branch = names(myclusters))

# sort by cluster ascending
clusterDFSort <- clusterDF %>% arrange(Cluster)https://stackoverflow.com/questions/25452472
复制相似问题
腾讯云开发者
