
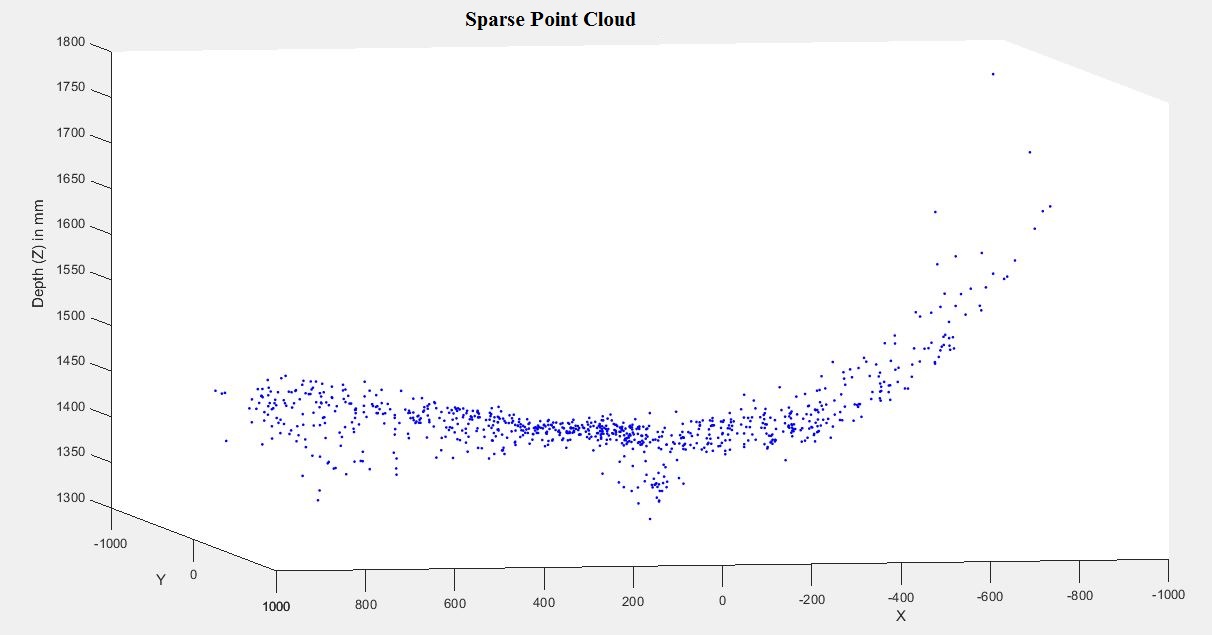
翘曲/弯曲点云
我正在用校准的立体声对进行稀疏重建。这是我逐步采取的办法:
我用MATLAB中的立体相机校准程序校准了我的立体声相机。
我拍摄了一对立体声图像,每个图像都不失真。
3-我检测、提取和匹配点特征。
4.利用MATLAB中的三角化函数,将stereoParametes对象传递到三角剖分中,得到匹配点的三维坐标。得到的三维坐标是相对于相机1的光学中心(右相机),它是毫米。
问题是,点云似乎是扭曲和弯曲的边缘图像。起初,在我看来,这就像是镜片的桶形变形。因此,我重新校准了大黄蜂XB3相机使用MATLAB相机校准器应用。但这一次,我使用了3个径向畸变系数,也包括切向和倾斜参数。但结果是一样的。我也尝试了加州理工学院的相机校准工具箱,但它的结果与MATLAB相同。在这两个工具箱中,径向失真系数是相似的。另外一个问题是,点云中的Z值都是负值,但我认为这可能是因为我使用右摄像机作为相机1,左相机作为相机2,而不是MATLAB的坐标系在链接中。
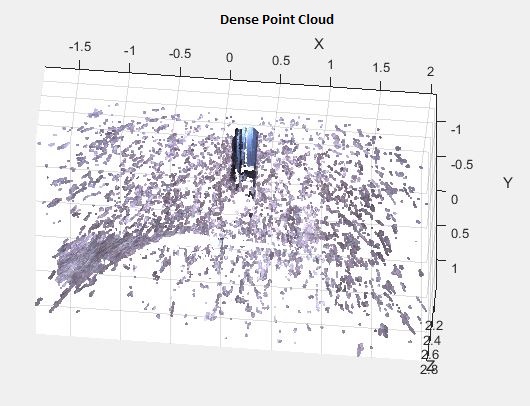
我已经附上了从稀疏和密集的三维重建三维点云的几张图片。我没有介入密集的3D,但只是想做它,看看问题是否仍然存在,它确实存在。我相信这意味着主要的问题是图像和相机校准,而不是算法。
现在我的问题是:
1-产生扭曲/弯曲三维点云的主要原因是什么?是只进行相机校准,还是其他步骤也会带来误差?我该怎么查呢?
2-除了MATLAB和加州理工学院的相机外,你还能推荐另一个相机校准工具箱吗?也许更适合径向畸变?
谢谢
图片:
链接:
坐标系统
代码:
clear
close all
clc

load('mystereoparams.mat');
I11 = imread('Right.tif');
I22 = imread('Left.tif');
figure, imshowpair(I11, I22, 'montage');
title('Pair of Original Images');

[I1, newOrigin1] = undistortImage(I11,stereoParams.CameraParameters1);
[I2, newOrigin2] = undistortImage(I22,stereoParams.CameraParameters2);
figure, imshowpair(I1, I2, 'montage');
title('Undistorted Images');

% Detect feature points
imagePoints1 = detectSURFFeatures(rgb2gray(I1), 'MetricThreshold', 600);
imagePoints2 = detectSURFFeatures(rgb2gray(I2), 'MetricThreshold', 600);

% Extract feature descriptors
features1 = extractFeatures(rgb2gray(I1), imagePoints1);
features2 = extractFeatures(rgb2gray(I2), imagePoints2);

% Visualize several extracted SURF features
figure;
imshow(I1);
title('1500 Strongest Feature Points from Image1');
hold on;
plot(selectStrongest(imagePoints1, 1500));

indexPairs = matchFeatures(features1, features2, 'MaxRatio', 0.4);
matchedPoints1 = imagePoints1(indexPairs(:, 1));
matchedPoints2 = imagePoints2(indexPairs(:, 2));

% Visualize correspondences
figure;
showMatchedFeatures(I1, I2, matchedPoints1, matchedPoints2,'montage');
title('Original Matched Features from Globe01 and Globe02');

% Transform matched points to the original image's coordinates
matchedPoints1.Location = bsxfun(@plus, matchedPoints1.Location, newOrigin1);
matchedPoints2.Location = bsxfun(@plus, matchedPoints2.Location, newOrigin2);

[Cloud, reprojErrors] = triangulate(matchedPoints1, matchedPoints2, stereoParams);
figure;plot3(Cloud(:,1),Cloud(:,2),Cloud(:,3),'b.');title('Point Cloud before noisy match removal');
xlabel('X'), ylabel('Y'), zlabel('Depth (Z) in mm')

% Eliminate noisy points
meanmean=mean(sqrt(sum(reprojErrors .^ 2, 2)))
standdev=std(sqrt(sum(reprojErrors .^ 2, 2)))
errorDists = max(sqrt(sum(reprojErrors.^2,2)),[],14);

validIdx = errorDists < meanmean+standdev;
tt1=find(Cloud(:,3)>0);
validIdx(tt1)=0;
tt2=find(abs(Cloud(:,3))>1800);
validIdx(tt2)=0;
tt3=find(abs(Cloud(:,3))<1000);
validIdx(tt3)=0;

points3D = Cloud(validIdx, :);

figure;plot3(points3D(:,1),points3D(:,2),points3D(:,3),'b.');title('Point Cloud after noisy match removal');
xlabel('X'), ylabel('Y'), zlabel('Depth (Z) in mm')

validPoints1 = matchedPoints1(validIdx, :);
validPoints2 = matchedPoints2(validIdx, :);

figure;
showMatchedFeatures(I1, I2, validPoints1,validPoints2,'montage');
title('Matched Features After Removing Noisy Matches');

% get the color of each reconstructed point
validPoints1 = round(validPoints1.Location);
numPixels = size(I1, 1) * size(I1, 2);
allColors = reshape(im2double(I1), [numPixels, 3]);
colorIdx = sub2ind([size(I1, 1), size(I1, 2)], validPoints1(:,2), ...
    validPoints1(:, 1));
color = allColors(colorIdx, :);

% add green point representing the origin
points3D(end+1,:) = [0,0,0];
color(end+1,:) = [0,1,0];

% show images
figure('units','normalized','outerposition',[0 0 .5 .5])
subplot(1,2,1);
imshowpair(I1, I2, 'montage');
title('Original Images')

% plot point cloud
hAxes = subplot(1,2,2);
showPointCloud(points3D, color, 'Parent', hAxes, ...
    'VerticalAxisDir', 'down', 'MarkerSize', 40);
xlabel('x-axis (mm)');
ylabel('y-axis (mm)');
zlabel('z-axis (mm)')
title('Reconstructed Point Cloud');

figure, scatter3(points3D(:,1),points3D(:,2),points3D(:,3),50,color,'fill')
xlabel('x-axis (mm)');ylabel('y-axis (mm)');zlabel('z-axis (mm)')
title('Final colored Reconstructed Point Cloud');回答 1
Stack Overflow用户
发布于 2014-11-24 20:57:55
你的代码看上去是对的。问题似乎在于校准。事实是,你得到的扭曲图像的3个系数告诉我,你可能没有足够的数据点接近边缘的图像,以准确估计失真。不过,很难从你的图像中看到。如果你拍了一张有许多直线边缘的场景,并将其不变形,你会得到一个更好的想法。
因此,我建议采取更多的图像与棋盘尽可能接近边缘的图像,你可以得到。看看这是否有帮助。
另一件要看的是估计误差。在R2014b中,立体相机校准程序可以选择返回每个估计参数的标准误差值。这可以给你信心区间,并告诉你是否需要更多的数据点。看这个例子。
哦,还请确保您的校准图像不保存为jpeg。请使用像tiff或png这样的无损格式。
https://stackoverflow.com/questions/26900104
复制相似问题
腾讯云开发者
