
用R分析非线性数据
用R分析非线性数据
提问于 2014-11-16 06:06:55
我有以下数据,其中xx和yy之间似乎存在曲线关系:
head(ddf)
  xx yy
1  1 10
2  2  9
3  3 11
4  4  9
5  5  7
6  6  6

ddf = structure(list(xx = 1:23, yy = c(10L, 9L, 11L, 9L, 7L, 6L, 9L,
8L, 5L, 4L, 6L, 6L, 5L, 4L, 6L, 8L, 4L, 6L, 8L, 11L, 8L, 10L,
9L)), .Names = c("xx", "yy"), class = "data.frame", row.names = c(NA,
-23L))

with(ddf, plot(xx,yy))

我想对此进行分析,并得出如下结论:
- 寻找xx与yy之间的非线性关系
- 得到它的方程
- 求出其P值
- 如果可能的话,得到R(相关系数)(非线性)
- 绘制这条曲线
我知道nls,它给了我一个方程,但我必须输入一个公式,这可能是不正确的。我也不能得到曲线,这里的R和P值。
> nls(yy~a*(xx^b), data=ddf)
Nonlinear regression model
  model: yy ~ a * (xx^b)
   data: ddf
      a       b
 9.5337 -0.1184
 residual sum-of-squares: 95.85

Number of iterations to convergence: 8
Achieved convergence tolerance: 3.407e-06
Warning message:
In nls(yy ~ a * (xx^b), data = ddf) :
  No starting values specified for some parameters.
Initializing ‘a’, ‘b’ to '1.'.
Consider specifying 'start' or using a selfStart model
我也知道stat_smooth的ggplot,它可以绘制一条曲线。但这也没有给我公式,R和P值。
回答 1
Stack Overflow用户
回答已采纳
发布于 2014-11-16 06:22:14
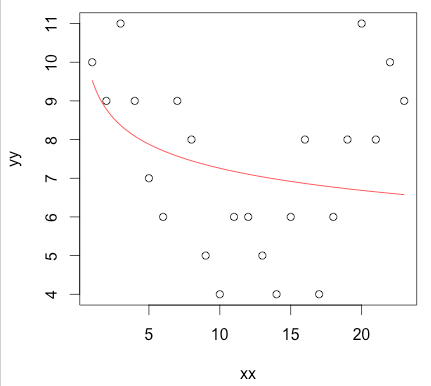
您可以预测新的xx值范围内的值并绘制它们。关于你想要的结果:
# 1. Find the nonlinear relation between xx and yy
fit <- nls(yy ~ a*xx^b, data=ddf)
# 2. Get its equation
coef(fit)
# 3. Get its P value
summary(fit)
# 4. If possible get R (correlation coefficient) (nonlinear)
cor(predict(fit), ddf$yy)
# 5. Plot this curve
newdat <- data.frame(xx=seq(min(ddf$xx), max(ddf$xx),,100))
newdat$yy <- predict(fit, newdat)
plot(yy ~ xx, ddf)
lines(yy ~ xx, newdat, col=2)
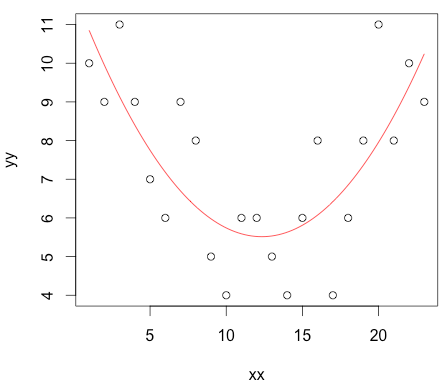
下面是使用多项式的另一个选项:
# 1. Find the nonlinear relation between xx and yy
fit <- lm(yy ~ poly(xx, n=2, raw=TRUE), data=ddf)
# 2. Get its equation
coef(fit)
# 3. Get its P value
summary(fit)
# 4. If possible get R (correlation coefficient) (nonlinear)
cor(predict(fit), ddf$yy)
# 5. Plot this curve
newdat <- data.frame(xx=seq(min(ddf$xx), max(ddf$xx),,100))
newdat$yy <- predict(fit, newdat)
plot(yy ~ xx, ddf)
lines(yy ~ xx, newdat, col=2)
最后,GAM版本:
# 1. Find the nonlinear relation between xx and yy
library(mgcv)
fit <- gam(yy ~ s(xx), data=ddf)
# 2. Get its equation
coef(fit)
# 3. Get its P value
summary(fit)
# 4. If possible get R (correlation coefficient) (nonlinear)
cor(predict(fit), ddf$yy)
# 5. Plot this curve
newdat <- data.frame(xx=seq(min(ddf$xx), max(ddf$xx),,100))
newdat$yy <- predict(fit, newdat)
plot(yy ~ xx, ddf)
lines(yy ~ xx, newdat, col=2)
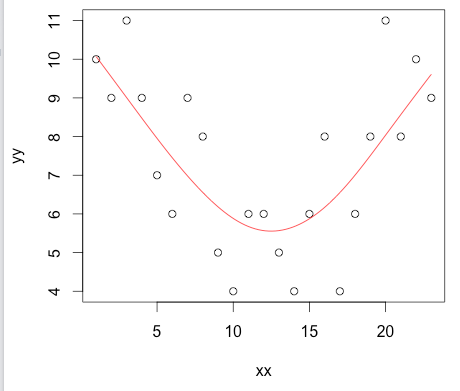
从GAM模型的系数中可以看出,这是一个更大的模型,更难以用公式表示。但是,你在它的形式上有很大的灵活性,如果这是最好的关系的话,它应该减少(通过更少的“结”)成一个线性模型。
页面原文内容由Stack Overflow提供。腾讯云小微IT领域专用引擎提供翻译支持
原文链接:
https://stackoverflow.com/questions/26954372
复制相关文章
相似问题
腾讯云开发者
