
如何在matlab中合并不同的图形但y轴相同
如何在matlab中合并不同的图形但y轴相同
提问于 2015-03-03 13:21:52
我经常在XRD图上看到这样的图形:
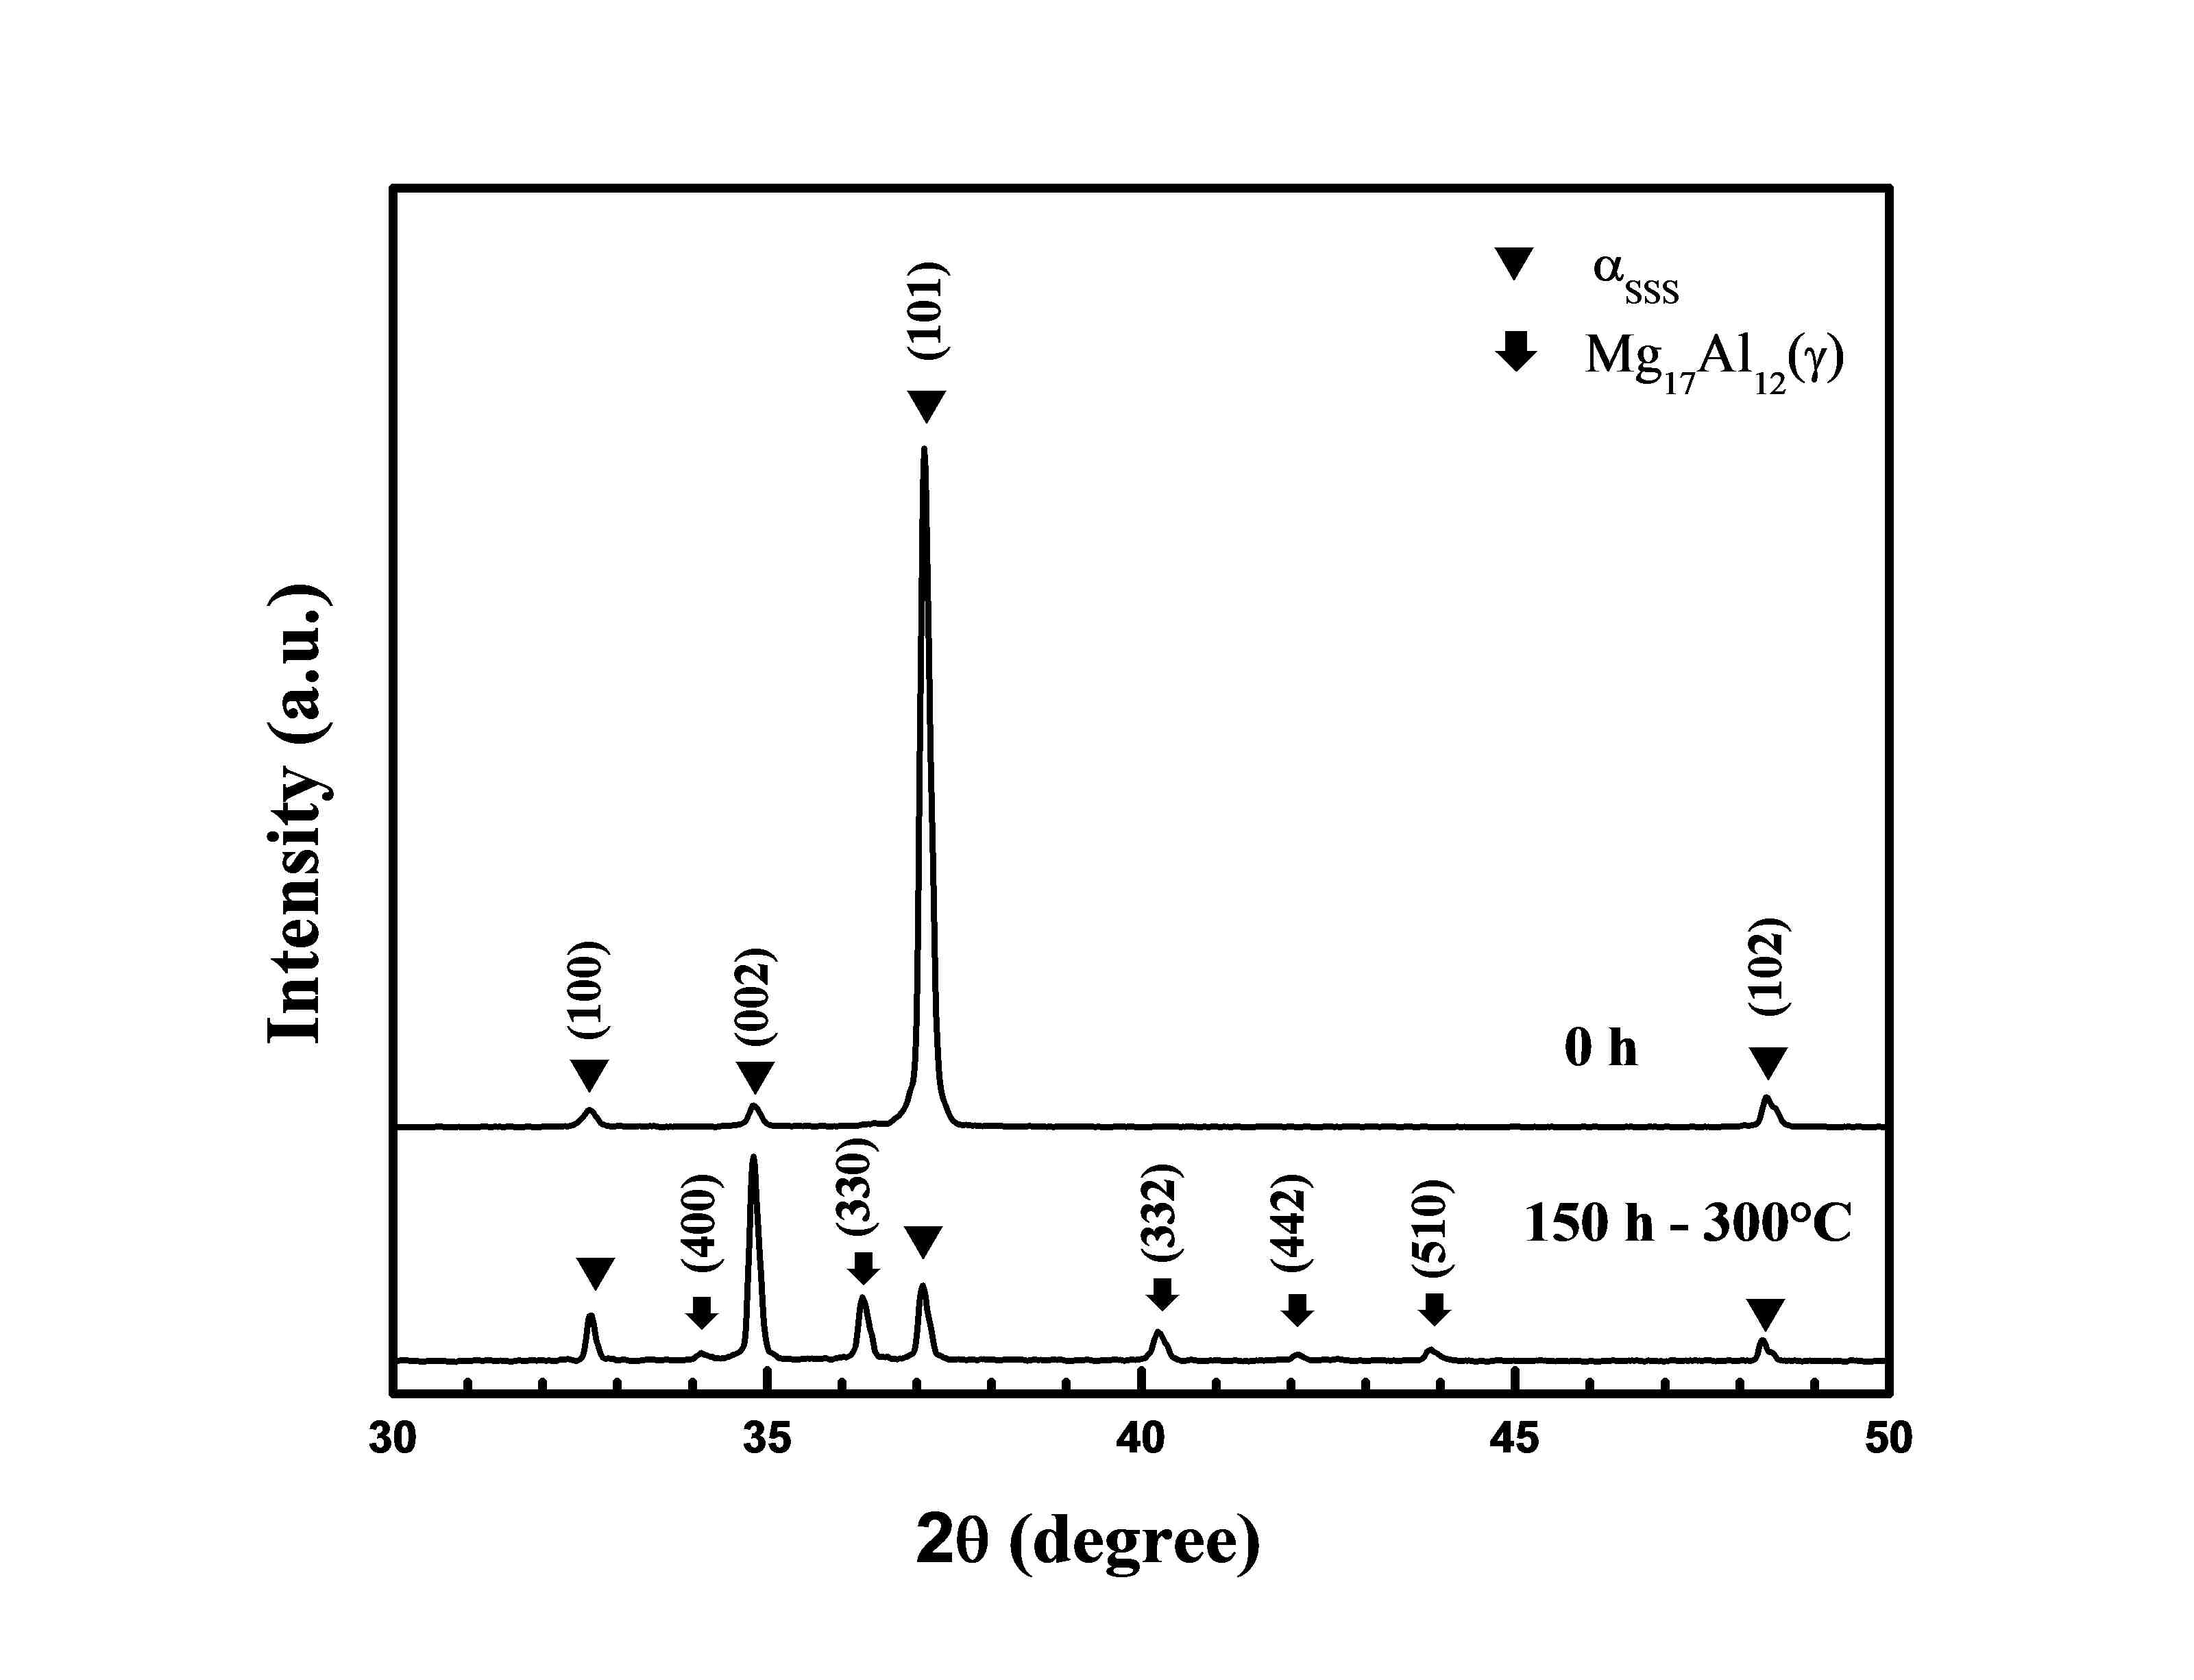
我想知道他们是怎么做到的?,如果你有不同的XRD图,假设有相同的y轴,matlab能做到这一点吗?谢谢。
回答 1
Stack Overflow用户
回答已采纳
发布于 2015-03-03 14:05:56
下面是一种实现it.You的方法,您可以根据自己的需要定制它,但是这应该会让您开始工作。
首先创建一个轴,并改变它在图形中的位置/大小,将它向上移动,为第二个轴腾出空间,以及删除你不想要的x和y标签。然后创建一个具有指定位置/大小的第二轴,使其适合于第一个轴。
样本代码:
clear
clc

%// Generate dummy data
x = 1:2:100;
y1 = rand(1,numel(x));

figure;

%// Make an axes and set its position
haxes1 = axes('Position',[.1 .1 .8 .7],'Color',[1 1 1])

%// Plot 1st curve
plot(x,y1,'Parent',haxes1)

%// Remove box and labels
box off
set(gca,'XTickLabel','','XTick',[],'YTick',[])

hold on

%// Get current axes position. You set it so you could get the parameters
%// directly as well.
axes1Pos = get(gca,'Position');

%// Shift 1st axes upward
set(gca,'Position',[axes1Pos(1) 2.6*axes1Pos(2) axes1Pos(3) axes1Pos(4)])

%// Change the poisition/size of the 2nd axes to fit below the 1st one
haxes2 = axes('Position',[axes1Pos(1) axes1Pos(2)/2.5 axes1Pos(3) axes1Pos(4)/2.5]) ;

%// Use linspace to generate colored points to use with scatter.
c = linspace(1,10,length(x));

%// Add 2nd plot and keep only x label
scatter(x,rand(1,numel(x)),40,c,'filled')
set(gca,'YTick',[])

box off

%// Place a ylabel for both axes
text(-4, 1.7,'Super nice y label','rotation',90,'FontSize',16,'HorizontalAlignment','center')
样本输出:
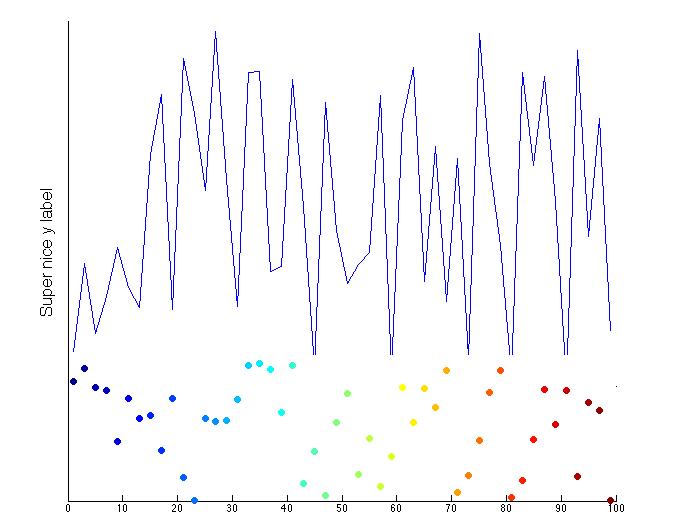
还有其他方法可以做到这一点。
希望这能帮上忙!
页面原文内容由Stack Overflow提供。腾讯云小微IT领域专用引擎提供翻译支持
原文链接:
https://stackoverflow.com/questions/28832914
复制相关文章
相似问题
腾讯云开发者
