
在ggmap包中绘制R的数据有问题
在ggmap包中绘制R的数据有问题
提问于 2015-03-10 01:26:05
我是一个新的R用户,所以不太适应这个语言。试图在英国曼彻斯特地图上绘制鸟类记录的位置。已经成功地用以下代码创建了映射
mymap<-get_map(c(lon=53.46388,lat=-2.294037),zoom=3,col="bw")
通过gdata将电子表格作为xlsx文件从excel中读取,这些列包含分配给Lon & Lat的lat和Lat。
似乎能够在地图上作为一个图层进行qplot &lat,但是当我尝试这样做时,我会得到以下错误
错误: ggplot2不知道如何处理类列表的数据
我已经尝试了这么多的代码组合,所以我不可能提供一个演示行,说明我是如何将数据附加到地图上的,我已经在网上学习了教程,但没有用--这在我的xlsx文件中有问题吗?
编辑:示例代码:
#Here is what Jamie Dunning tried:
require(ggmap)
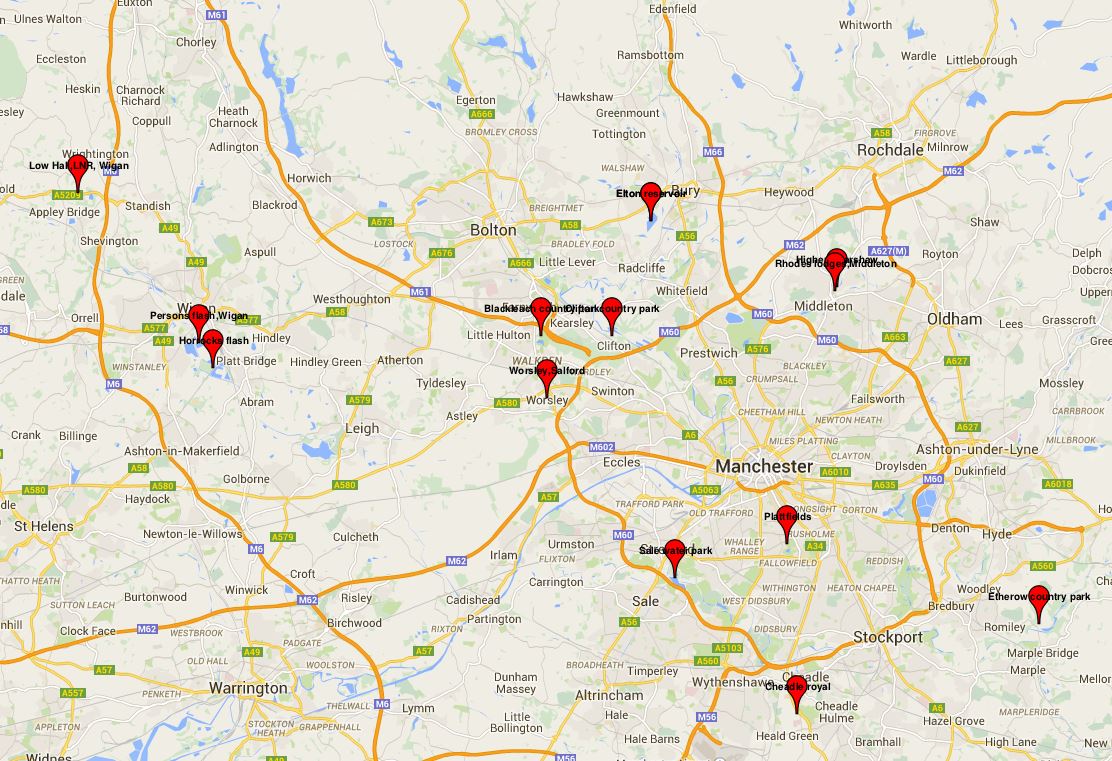
origin<-c("Worsley,Salford","Elton reservoir","Etherow country park","Blackleach country park","Low Hall,LNR, Wigan","Cheadle royal","Rhodes lodges,Middleton","Persons flash,Wigan","Sale water park","Plattfields","Higher Boarshaw","Clifton country park","Horrocks flash")
ringing.origins<-geocode(origin)
map<-c(get_map("Greater Manchester")
swans.coor<-cbind(ringing.origins$lon,ringing.origins$lat)我还没有一个成功绘制它们的例子。
回答 2
Stack Overflow用户
回答已采纳
发布于 2015-03-27 16:35:44
使用plotGoogleMaps的另一种选择
1-获取坐标
require(ggmap)

#List places to find GPS coordinates for:
    origin<-c("Worsley,Salford","Elton reservoir","Etherow country park","Elton reservoir","Blackleach country park","Low Hall,LNR, Wigan","Cheadle royal","Rhodes lodges,Middleton","Persons flash,Wigan","Sale water park","Plattfields","Higher Boarshaw","Clifton country park","Horrocks flash")

#Get coordinates via geocode function
    ringing.origins<-geocode(origin)

#Put these coordinates in a data frame for creating an SP object later
    df <- as.data.frame(origin)
    row.names(df) <- 1:nrow(df)
2-创建空间对象
require(sp)
#Coordinates must be numeric and binded together as one element and rows numbered:
    ringing.origins$lon <- as.numeric(ringing.origins$lon)
    ringing.origins$lat <- as.numeric(ringing.origins$lat)
    coord <- cbind(ringing.origins$lon,ringing.origins$lat)
    row.names(coord) <- 1:nrow(coord)
#Define a mapping projection
    AACRS <- CRS("+proj=longlat +ellps=WGS84")
#Creating a spatial object of "df" using the binded coordinates "coord":
    Map2 <- SpatialPointsDataFrame(coord, df, proj4string = AACRS, match.ID = TRUE)
3-创建一个交互式html googlemap:
 require(plotGoogleMaps)
    #Simple Map
    plotGoogleMaps(Map2)
    #Map with some options, filename creates a file in the working directory.
    plotGoogleMaps(Map2, mapTypeId="ROADMAP", colPalette="red", legend=FALSE, filename="Swan_Map.htm")
Stack Overflow用户
发布于 2015-03-27 16:17:40
使用ggmap绘图
require(ggmap)
#Get your coordinates
origin<-c("Worsley,Salford","Elton reservoir","Etherow country park","Elton reservoir","Blackleach country park","Low Hall,LNR, Wigan","Cheadle royal","Rhodes lodges,Middleton","Persons flash,Wigan","Sale water park","Plattfields","Higher Boarshaw","Clifton country park","Horrocks flash")
ringing.origins<-geocode(origin)

#Map of Greater Manchester
map<-get_map("Greater Manchester")
ggmap(map, extent = 'normal') +
  geom_point(aes(x = lon, y = lat), data = ringing.origins)
#Box is too small...

#Bounding box with All points
mymap<-get_map(c(lon=-2.294037,lat=53.46388),zoom=10)
ggmap(mymap, extent = 'device') +
geom_point(aes(x = lon, y = lat), data = ringing.origins, alpha = 1)页面原文内容由Stack Overflow提供。腾讯云小微IT领域专用引擎提供翻译支持
原文链接:
https://stackoverflow.com/questions/28954705
复制相关文章
相似问题
腾讯云开发者
