
如何手动设置X轴的值
如何手动设置X轴的值
提问于 2015-03-10 07:38:59
我从两个文件"80211“和"newfile”中读取数据。它们都有一个列数据,没有任何标题。我有下面的代码,但我不能手动设置x轴值。在图中,x值显示为1和2,但我需要手动执行。(它们是1和2,因为没有标题,它们会自动地给出1和2)
data1 <- scan(pipe('cut -f1 -d, 80211'))
data2 <- scan(pipe('cut -f1 -d, newfile'))
df <- data.frame(x = c(data1, data2), ggg=factor(rep(1:2, c(19365,19365))))
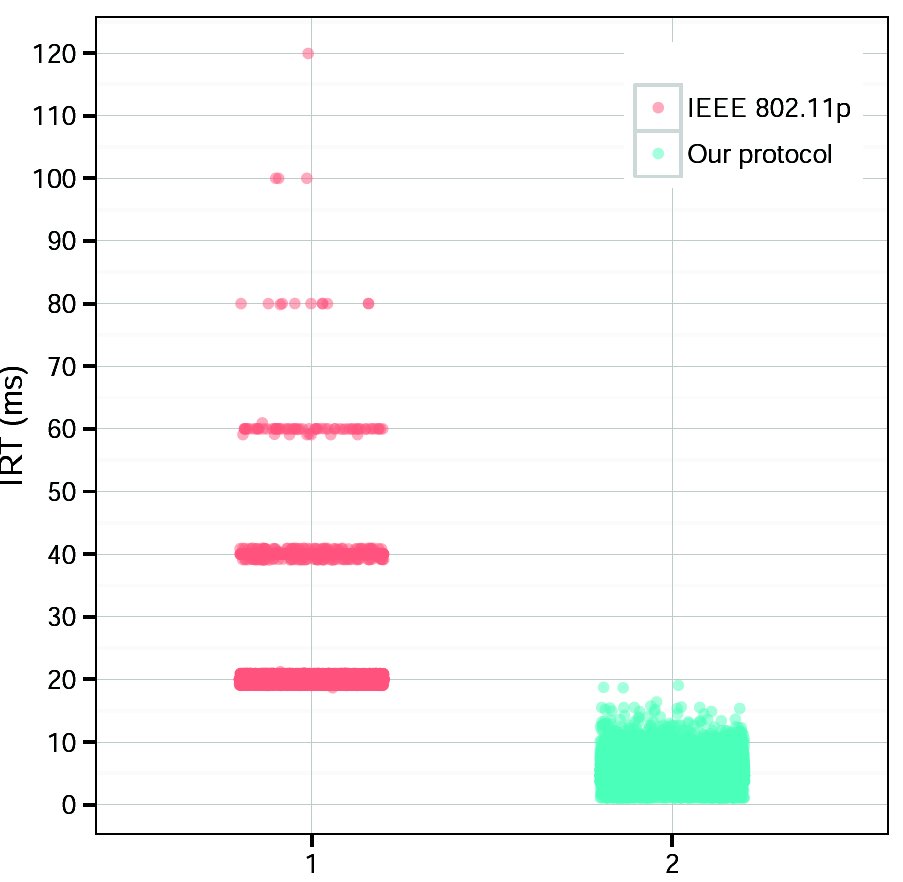
ggplot(df, aes(x=ggg, y=x, fill=ggg)) +
geom_jitter(alpha=0.5, aes(color=ggg),position = position_jitter(width = .2)) +
guides(fill=FALSE) + scale_y_continuous(breaks=seq(0, 200, 10)) +
xlab('') +
ylab('IRT (ms)')这是结果,但我想用"ieee“和”of“来命名x轴值,而不是1和2。
回答 1
Stack Overflow用户
回答已采纳
发布于 2015-03-11 03:06:48
你可以控制x轴标签在ggplot中使用比例和标签。请参阅此处的文档:continuous.html或discrete.html。在您的情况下,我相信下面的工作,虽然我无法复制您的数据集。
ggplot(df, aes(x=ggg, y=x, fill=ggg)) +
geom_jitter(alpha=0.5, aes(color=ggg),position = position_jitter(width = .2)) +
guides(fill=FALSE) + scale_y_continuous(breaks=seq(0, 200, 10)) +
xlab('') +
ylab('IRT (ms)') +
scale_x_discrete(breaks = c(1,2),labels=as.character(c("ieee","mine")))页面原文内容由Stack Overflow提供。腾讯云小微IT领域专用引擎提供翻译支持
原文链接:
https://stackoverflow.com/questions/28958333
复制相关文章
相似问题
腾讯云开发者
