
在matplotlib中绘制正方形等高线图
在matplotlib中绘制正方形等高线图
提问于 2015-03-17 21:07:20
我不能让matplotlib用相等的x和y轴绘制等高线图。请注意,我尝试用相同的图形大小(10,10)定义图形,并在轴函数中尝试“相等”。这两项工作,正如“圆圈”所显示的,都是椭圆形的:
import matplotlib.pyplot as plt
from matplotlib.colors import BoundaryNorm
from matplotlib.ticker import MaxNLocator
import numpy as np

# generate 2 2d grids for the x & y bounds
y, x = np.mgrid[slice(0, 1 + 0.1, 0.1),
                slice(0, 1 + 0.1, 0.1)]

z = y + x
z = z[:-1, :-1]
levels = MaxNLocator(nbins=15).tick_values(z.min(), z.max())

# pick the desired colormap, sensible levels, and define a normalization
# instance which takes data values and translates those into levels.
plt.figure(num=None, figsize=(10,10))
cmap = plt.get_cmap('nipy_spectral')
norm = BoundaryNorm(levels, ncolors=cmap.N, clip=True)

# contours are *point* based plots, so convert our bound into point centers
plt.contour(x[:-1, :-1] + 0.1 / 2.,
            y[:-1, :-1] + 0.1 / 2., z, levels=levels,
            cmap=cmap, zorder=1)

plt.colorbar()
plt.axis([0, 1, 0, 1],'equal')
plt.tight_layout()

circle=plt.Circle((0.4,0.5),.1,color='k',fill=False)
plt.gca().add_artist(circle)

plt.savefig('not_square')回答 1
Stack Overflow用户
回答已采纳
发布于 2020-04-26 16:24:39
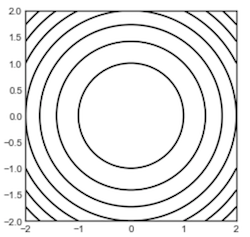
要获得正方形图,请尝试plt.axis('square');
def f(x, y):
    return x ** 2 + y ** 2

x = np.linspace(-2, 2, 50)
y = np.linspace(-2, 2, 50)

X, Y = np.meshgrid(x, y)
Z = f(X, Y)

plt.contour(X, Y, Z, colors='black');
plt.axis('square');
页面原文内容由Stack Overflow提供。腾讯云小微IT领域专用引擎提供翻译支持
原文链接:
https://stackoverflow.com/questions/29109695
复制相关文章
相似问题
腾讯云开发者
