
在R中使用facet_wrap时,将水平线(或文本)添加到单独的方框图中
在R中使用facet_wrap时,将水平线(或文本)添加到单独的方框图中
提问于 2015-03-23 13:29:09
我想在使用facet_wrap函数创建的每个盒子图中添加一条水平线。这是我的代码,它创建了我的盒图:
ggplot(data=new.dat, aes(variable, value)) + geom_boxplot() +
  facet_wrap(~variable, scales="free", ncol=4) +
  scale_x_discrete(breaks=NULL) +
  labs(x="",y="")
这是我想为每条水平线使用的数据:
dat_hlines <- data.frame(cond=c("S1mgg","S2mgg","S3mgg","TOC",
                                "HI","OI","PI","TmaxC"),
                         hline=c(7.5,20,7.5,400,10,10,400,500))
这是我最近的发现:
ggplot(data=new.dat, aes(variable, value)) + geom_boxplot() +
  geom_hline(data=dat_hlines,aes(yintercept=hline)) +
  facet_wrap(~variable, scales="free", ncol=4) +
  scale_x_discrete(breaks=NULL) +
  labs(x="",y="")
出现的是多行,即在每个框图上重复的相同行。
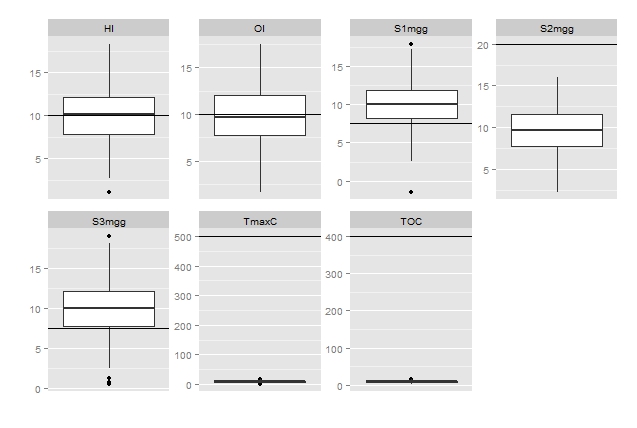
我想要的是每幅图一行,每一行与dat_hlines$hline中的观测结果相对应
附注:我会张贴图形,但我的分数不允许。
数据
tmp<- data.frame(matrix(vector(), 200, 2, dimnames=list(c(),
              c("variable", "value"))), stringsAsFactors=F)
tmp[1]<-"S1mgg"
tmp[2]<-rnorm(200, mean=10, sd=3)

tmp2<- data.frame(matrix(vector(), 200, 2, dimnames=list(c(),
       c("variable", "value"))), stringsAsFactors=F)
tmp2[1]<-"S2mgg"
tmp2[2]<-rnorm(200, mean=10, sd=3)

tmp3<- data.frame(matrix(vector(), 200, 2, dimnames=list(c(),
       c("variable", "value"))), stringsAsFactors=F)
tmp3[1]<-"S3mgg"
tmp3[2]<-rnorm(200, mean=10, sd=3)

tmp4<- data.frame(matrix(vector(), 200, 2, dimnames=list(c(),
       c("variable", "value"))), stringsAsFactors=F)
tmp4[1]<-"S3mgg"
tmp4[2]<-rnorm(200, mean=10, sd=3)

tmp5<- data.frame(matrix(vector(), 200, 2, dimnames=list(c(),
       c("variable", "value"))), stringsAsFactors=F)
tmp5[1]<-"TOC"
tmp5[2]<-rnorm(200, mean=10, sd=3)

tmp6<- data.frame(matrix(vector(), 200, 2, dimnames=list(c(),
       c("variable", "value"))), stringsAsFactors=F)
tmp6[1]<-"HI"
tmp6[2]<-rnorm(200, mean=10, sd=3)

tmp7<- data.frame(matrix(vector(), 200, 2, dimnames=list(c(),
       c("variable", "value"))), stringsAsFactors=F)
tmp7[1]<-"OI"
tmp7[2]<-rnorm(200, mean=10, sd=3)

tmp8<- data.frame(matrix(vector(), 200, 2, dimnames=list(c(),
      c("variable", "value"))), stringsAsFactors=F)
tmp8[1]<-"TmaxC"
tmp8[2]<-rnorm(200, mean=10, sd=3)

new.dat<-rbind(tmp,tmp2,tmp3,tmp4,tmp5,tmp6,tmp7,tmp8)回答 1
Stack Overflow用户
回答已采纳
发布于 2015-03-23 16:42:14
那这个呢?
new_data <- merge(new.dat, dat_hlines, by.x = "variable", by.y = "cond")
ggplot(data=new_data, aes(variable, value)) + geom_boxplot() +
    facet_wrap(~variable, scales="free", ncol=4) +
    scale_x_discrete(breaks=NULL) +
    labs(x="",y="") + geom_hline(aes(yintercept = hline))
这意味着:
页面原文内容由Stack Overflow提供。腾讯云小微IT领域专用引擎提供翻译支持
原文链接:
https://stackoverflow.com/questions/29211508
复制相关文章
相似问题
腾讯云开发者
