
用MATLAB可视化三维阵列类立方点阵
用MATLAB可视化三维阵列类立方点阵
提问于 2015-03-24 10:20:21
我想用MATLAB可视化一个三维阵列,就像立方格子。
我读过How to plot 3D grid (cube) in Matlab和Simple cubic lattice using three-dimensional array
如果数组中的元素只有0和1,我知道如何使用三维数组来绘制一个简单的立方格,小立方体的大小是相同的。
但是,现在我有了这样一个三维数组,
cube(:,:,1) =
 1     0     1
 0     1     1
 2    1     0
cube(:,:,2) =

 0     0     1
 1     5     1
 0     1     0

cube(:,:,3) =

 1     1     1
 0     1     1
 2    0     1
数组立方体的值除0和1外,我想将数组可视化为立方格,其中多维数据集(:,:,1)表示立方格的第一层,
 cube(:,:,2) denotes the second floor, and
 cube(:,:,3) the third floor.
值0表示无意义,而值1表示小的蓝色立方体。
大于1的值表示球体,球体的直径随值的变化而变化。期望的结果如下所示:
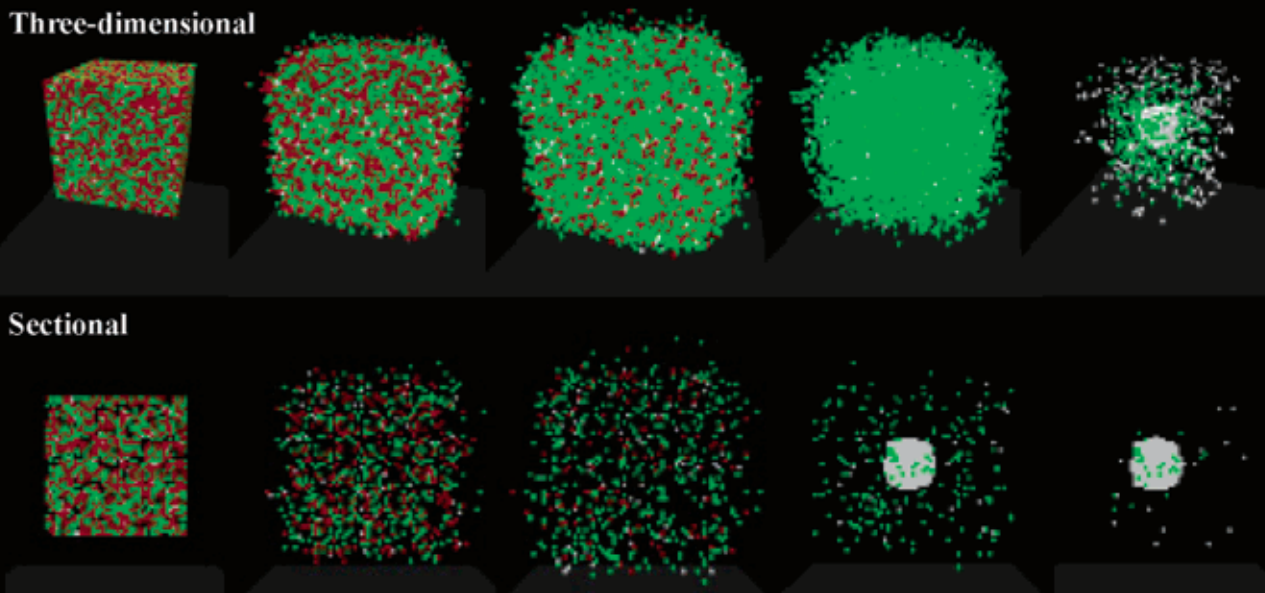
三维阵列的可视化,1表示一个小的绿色立方体,0表示任何东西,大于1的值代表白色的球体,球体的直径随数值的变化而变化。
为了更清楚地解释我的问题,请展示二维数组的可视化。

1表示一个小黑球,0表示没有,大于1表示白色球体,球体直径随值变化而变化。
期望效果图
好的,当立方体的边长是1
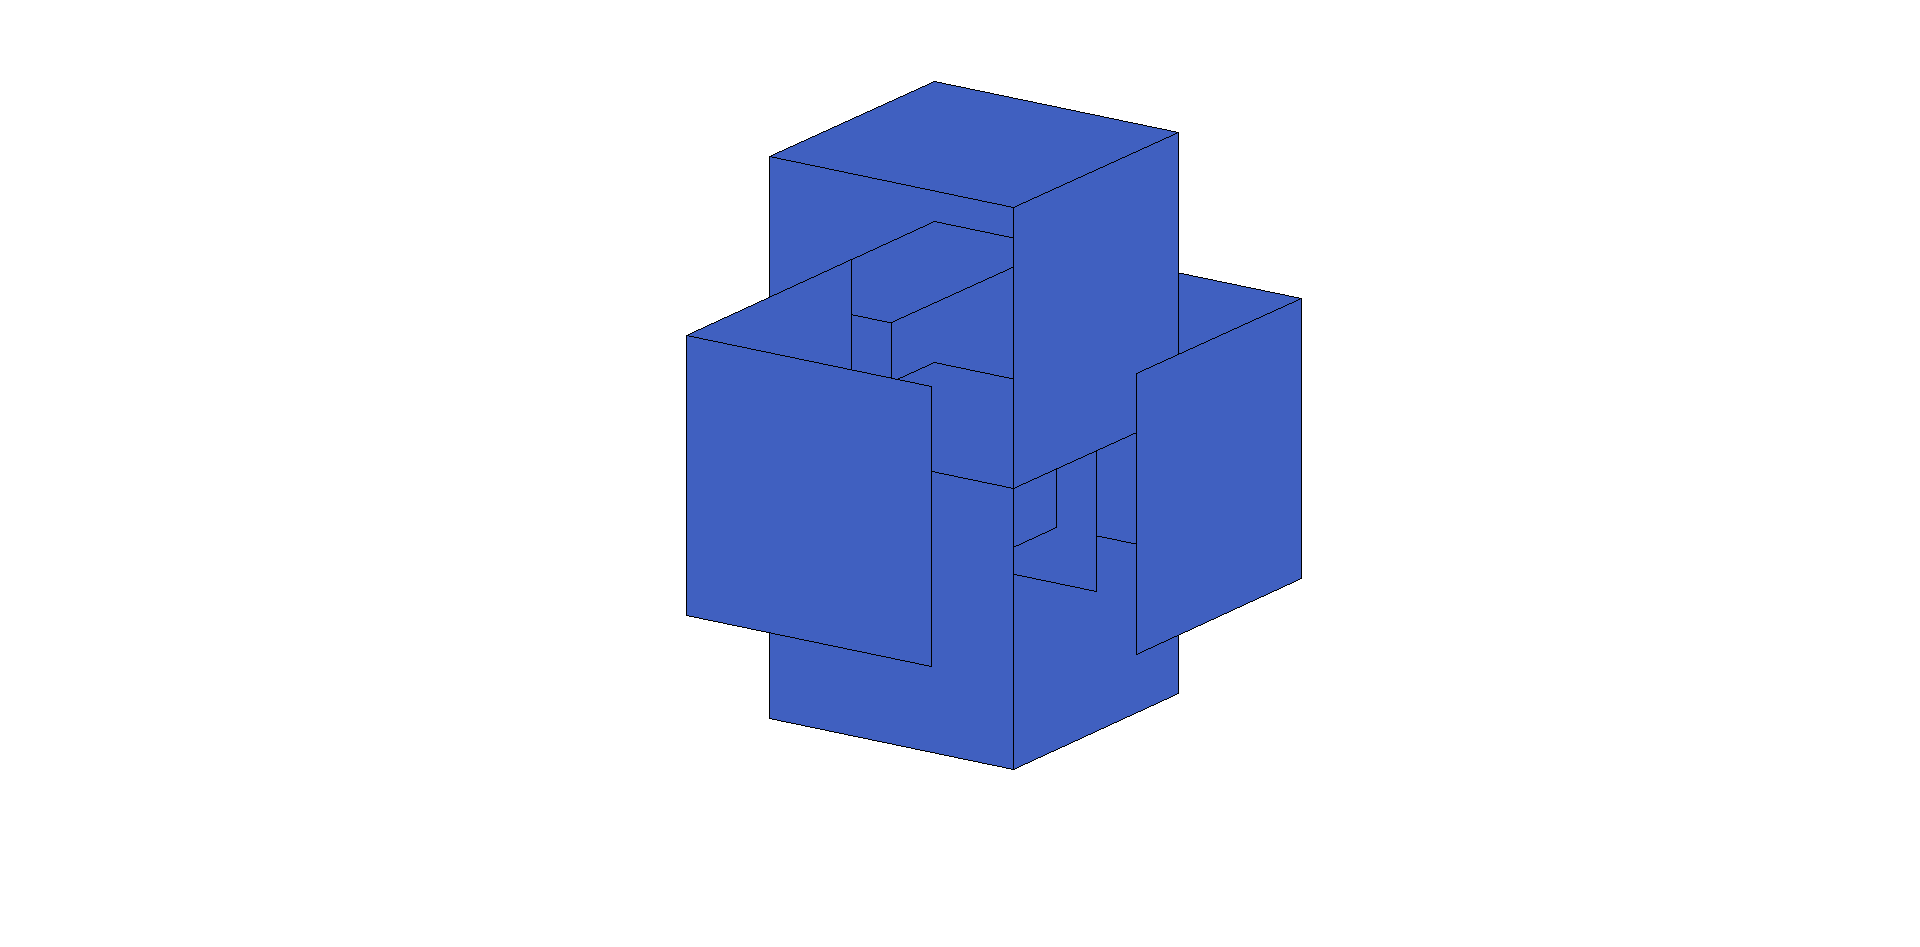
当边长设为2时,drawCube(ix,iy,iz,2,Royal_Blue)。问题发生了,立方体是重叠的,
回答 1
Stack Overflow用户
回答已采纳
发布于 2015-03-24 12:50:12
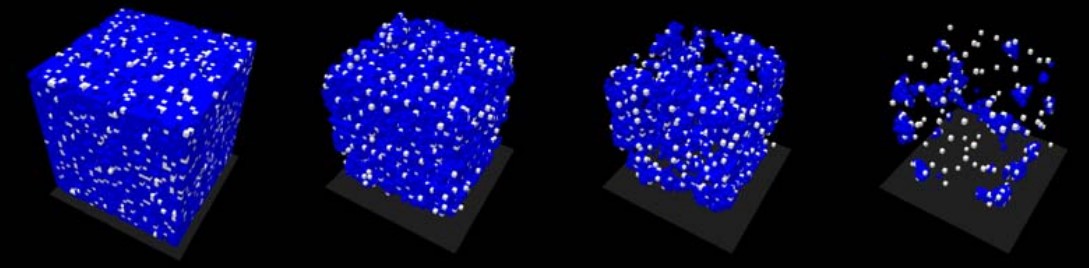
让我给你展示一下我的尝试。它以独立绘制每个立方体和圆为基础。如果A是大的,这将是缓慢的。
结果:
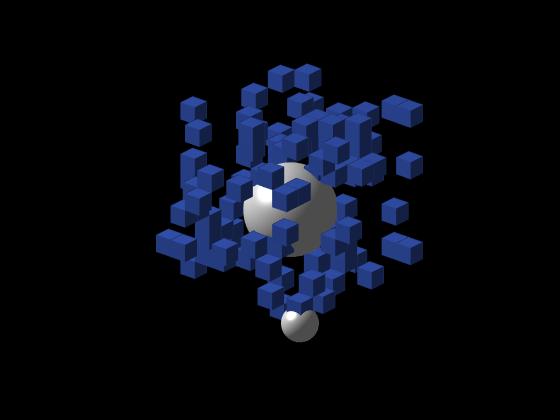
代码应该是不言自明的。
% Create some data. This piece of code just creates some matrix A with
% some 1s and 0s and inserts a 2 and a 3 to specific positions. Subsitute
% this with your own data matrix.
th=0.2;
A=double(rand(10,10,10)<th);
A(1,1,1)=2;
A(5,5,5)=3;

% A nice color. I just dont like the standard blue so I picked another one.
Royal_Blue=[65 105 225]/255;

%%%%%%%%%%%%%%%%%%%%%%
%% Draw cubes

% Obtain all the linear indexes (search mathworks for help between
% subscripts vs linear indices) of the locations where a cube is wanted
% (A==1)

ind=find(A==1);

% Create a figure
fig=figure();
hold on

% Draw the cubes one by one

for ii=1:length(ind)

    % For each linear index get its subscript (that also
    % will be x,y,z position)
    [ix,iy,iz]=ind2sub(size(A),ind(ii));

    % Use the drawcube function to draw a single cube in the
    % desired position with the desired size (1) and colour.
    drawCube([ix,iy,iz],1,Royal_Blue);
end

% Nice plotting code. This just makes the drawing nicer.

camlight left
lighting gouraud
axis equal
axis off
view(-50,25)

%%%%%%%%%%%%%%%
%% Now draw the spheres

% This code is the same as the previous one but I just draw
% spheres instead of cubes.
ind=find(A>1);
% create an sphere
[X,Y,Z] = sphere;
for ii=1:length(ind)
    [ix,iy,iz]=ind2sub(size(A),ind(ii));
    % scale sphere
    Xs=X*A(ix,iy,iz)/2;
    Ys=Y*A(ix,iy,iz)/2;
    Zs=Z*A(ix,iy,iz)/2;
    surf(Xs+ix,Ys+iy,Zs+iz,'edgecolor','none','facecolor',[1 1 1]);

end

% Change the background colour to black
whitebg(fig,'k')
% MAke sure it stays black
set(gcf, 'InvertHardCopy', 'off');函数drawCube如下:
function drawCube( origin, size,color)
% From
% http://www.mathworks.com/matlabcentral/newsreader/view_thread/235581

if nargin<3
    color='b';

end
x=([0 1 1 0 0 0;1 1 0 0 1 1;1 1 0 0 1 1;0 1 1 0 0 0]-0.5)*size+origin(1);
y=([0 0 1 1 0 0;0 1 1 0 0 0;0 1 1 0 1 1;0 0 1 1 1 1]-0.5)*size+origin(2);
z=([0 0 0 0 0 1;0 0 0 0 0 1;1 1 1 1 0 1;1 1 1 1 0 1]-0.5)*size+origin(3);
for i=1:6
    h=patch(x(:,i),y(:,i),z(:,i),color);

    set(h,'edgecolor','none')

end

end页面原文内容由Stack Overflow提供。腾讯云小微IT领域专用引擎提供翻译支持
原文链接:
https://stackoverflow.com/questions/29229988
复制相关文章
相似问题
腾讯云开发者
