
MATLAB:尝试在3x2子图中添加共享的xlabel,ylabel
MATLAB:尝试在3x2子图中添加共享的xlabel,ylabel
提问于 2015-06-11 21:33:59
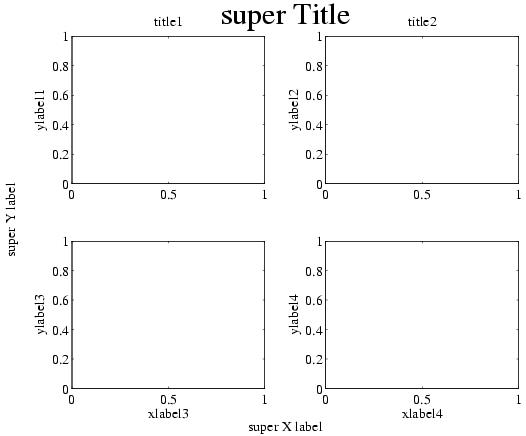
正如标题说的那样,我要做的是相当直截了当。我有一个由m=3,n=2子图组成的网格。它们代表了测量相同参数的6个不同实验的图表。我想在这六个子图的边界上有一个x标签和一个y标签。不幸的是,到目前为止,我还没有找到一种简单的方法来做到这一点。(xlabel只是将xlabel放在最后一个活动子图下)。有人知道怎么做吗?
哦,我该如何在标有度符号的标签上显示摄氏度呢?(小圆圈.)
回答 3
Stack Overflow用户
回答已采纳
发布于 2015-06-11 23:05:52
您可以使用mtit在子图周围创建一个不可见的轴。mtit返回那个轴的句柄,然后您可以为其创建xlabel和ylabel。
示例:
% create sample data
my_data = arrayfun(@(x)rand(10, 2) + repmat([x, 0], 10, 1), 1:6, 'UniformOutput', 0);
figure;
clf
ah = gobjects(6, 1); % use zeros if using an old version of MATLAB
% plot data
for ii = 1:6
ah(ii) = subplot(3, 2, ii);
plot(1:10, my_data{ii}(:, 1));
hold on
plot(1:10, my_data{ii}(:, 2));
end
% link axes to have same ranges
max_data = max(cellfun(@(x) max(x(:)), my_data));
min_data = min(cellfun(@(x) min(x(:)), my_data));
linkaxes(ah, 'xy')
ylim([min_data, max_data])
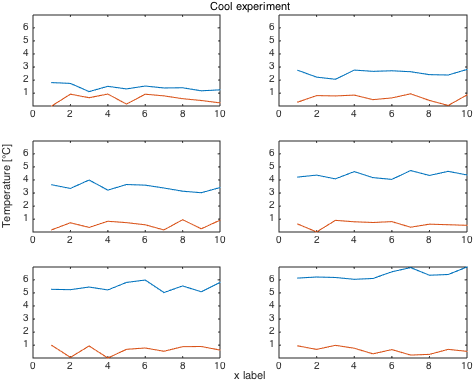
% Create invisible large axes with title (title could be empty)
hh = mtit('Cool experiment');
%set(gcf, 'currentAxes', hh.ah)
% make ylabels
ylh = ylabel(hh.ah, 'Temperature [°C]');
set(ylh, 'Visible', 'On')
xlh = xlabel(hh.ah, 'x label');
set(xlh, 'Visible', 'On')这将产生一个像这样的数字:
Stack Overflow用户
发布于 2015-06-12 00:11:54
我不知道在将xlabel和ylabel设置为每个子图时出现了什么错误。
我也不确定我是否理解问题。
下面的代码生成3x2子图,每个子图都带有它的xlabel和ylabel。
在第一种情况下,每个子图对于xlabel和ylabel都有不同的字符串。
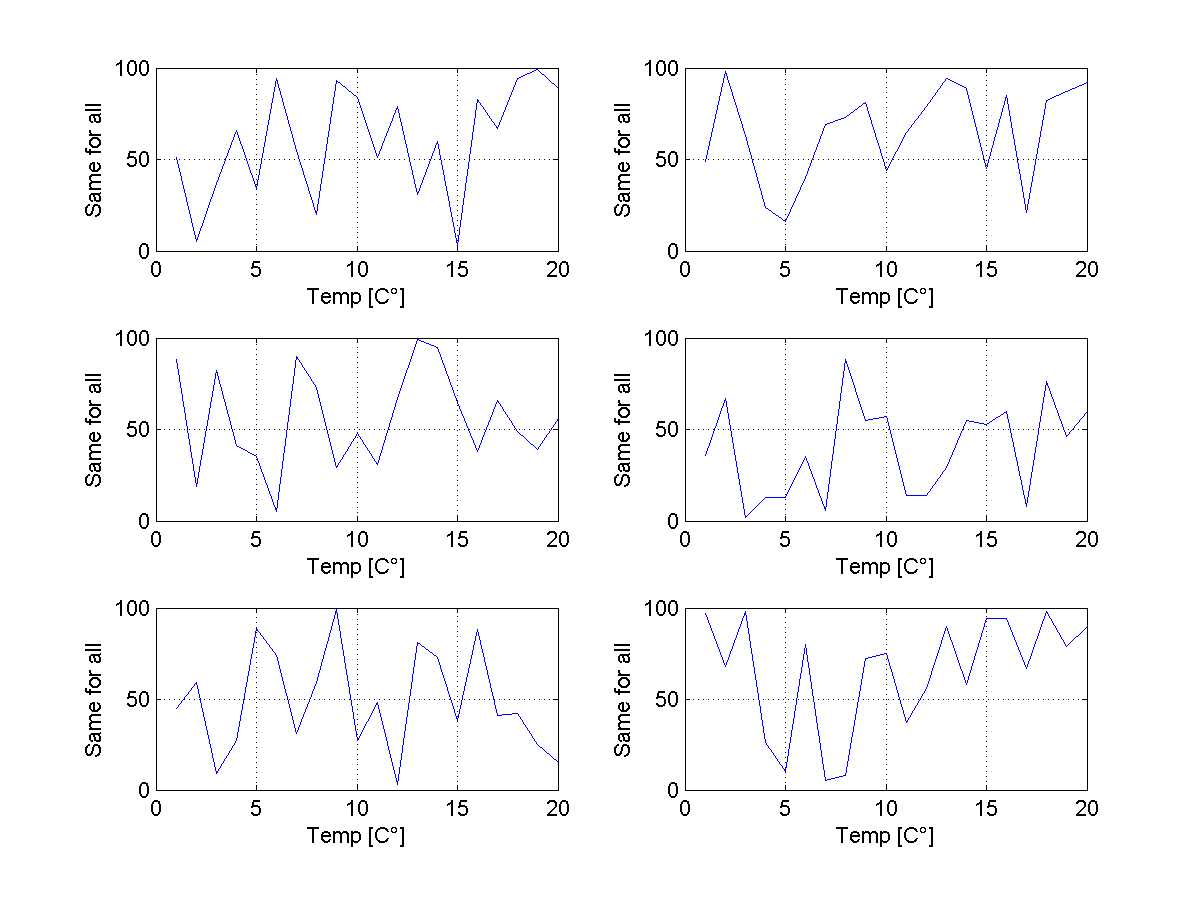
在第二部分中,对所有子倍增器设置相同的xlabel和ylabel。
要将"°“符号添加到标签中,只需这样定义一个char变量就足够了:
c='°'然后使用sprintf为xlabel和ylabel生成字符串。
a=randi(100,6,20)
figure

% Each subplot with its own xlabel and ylabel
for i=1:6
   hs(i)=subplot(3,2,i);
   plot(a(i,:))
   c='°'
   str=sprintf('Temp [C%c]',c)
   xlabel([str ' ' num2str(i)])
   ylabel(['Subplot ' num2str(i)])
   grid on
end

figure

% The same xlabel and ylabel for all the subplot
c='°';
x_label_str=sprintf('Temp [C%c]',c)
y_label_str='Same for all'

for i=1:6
   hs(i)=subplot(3,2,i);
   plot(a(i,:))
   xlabel(x_label_str)
   ylabel(y_label_str)
   grid on
end图1:每个子图的不同的xlabel,ylabel
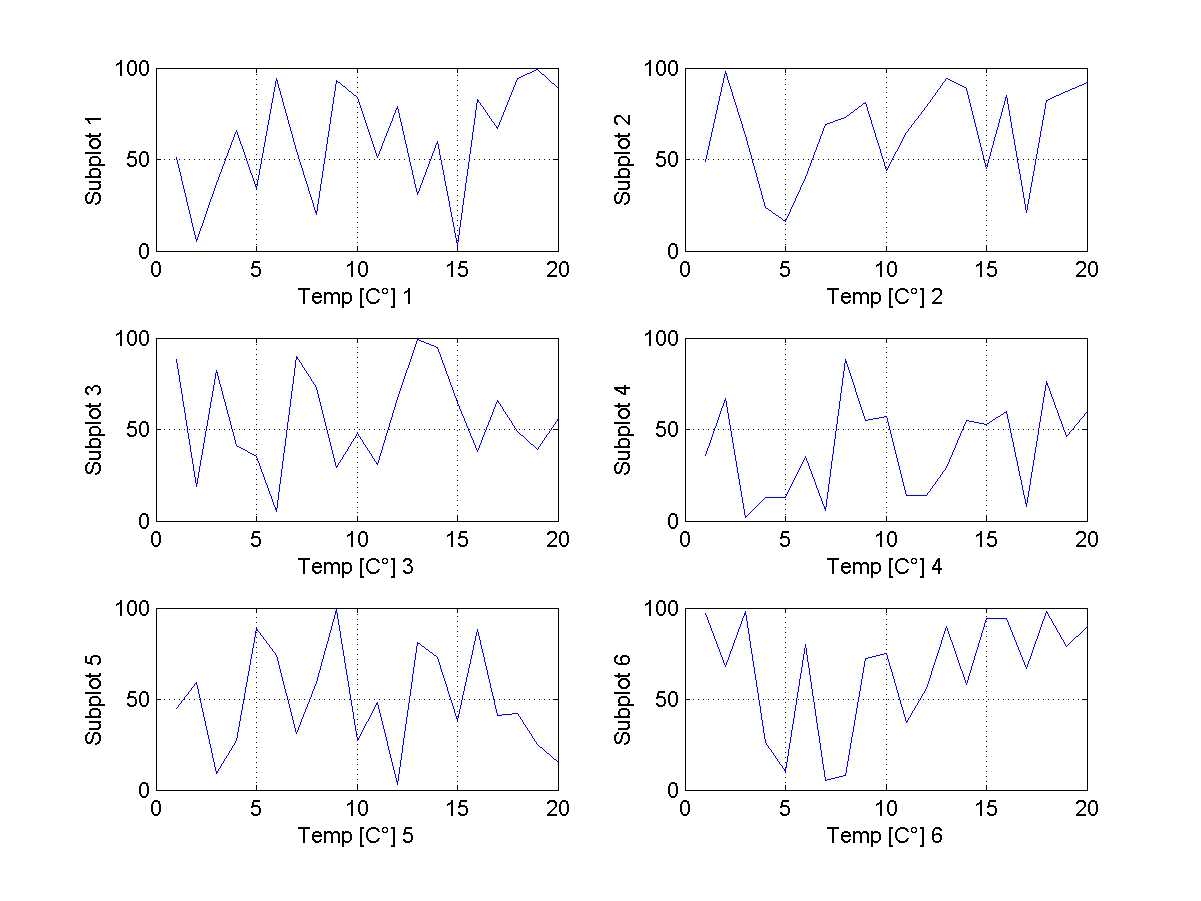
图2:对每个子图使用相同的xlabel,ylabel
希望这能有所帮助。
Stack Overflow用户
发布于 2016-04-11 15:42:08
页面原文内容由Stack Overflow提供。腾讯云小微IT领域专用引擎提供翻译支持
原文链接:
https://stackoverflow.com/questions/30791857
复制相关文章
相似问题
腾讯云开发者
