
读取CSV和图色线图
读取CSV和图色线图
提问于 2015-06-15 08:55:01
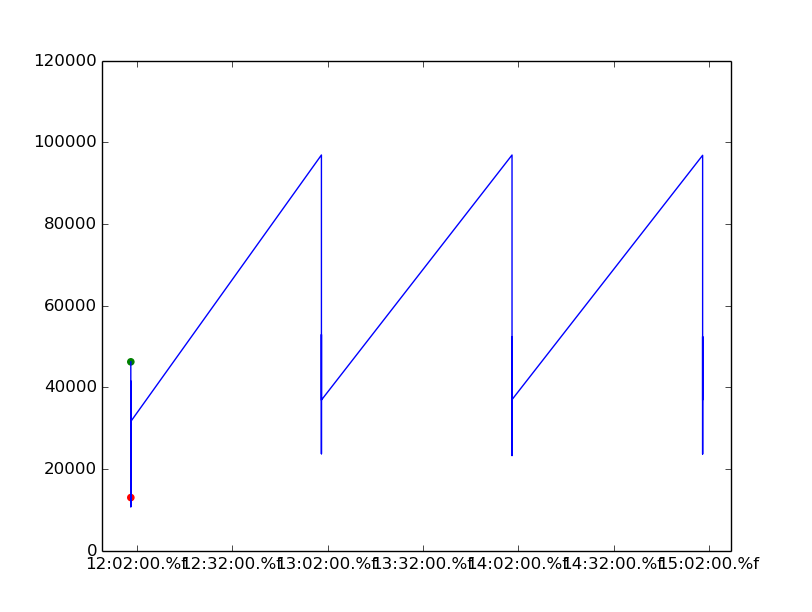
我试图用彩色标记在阈值前后绘制一个图形。如果我使用for循环for,用时间H:M读取输入文件的解析,我只能绘制和着色两个点。但对于所有的要点,我都无法策划。
输入
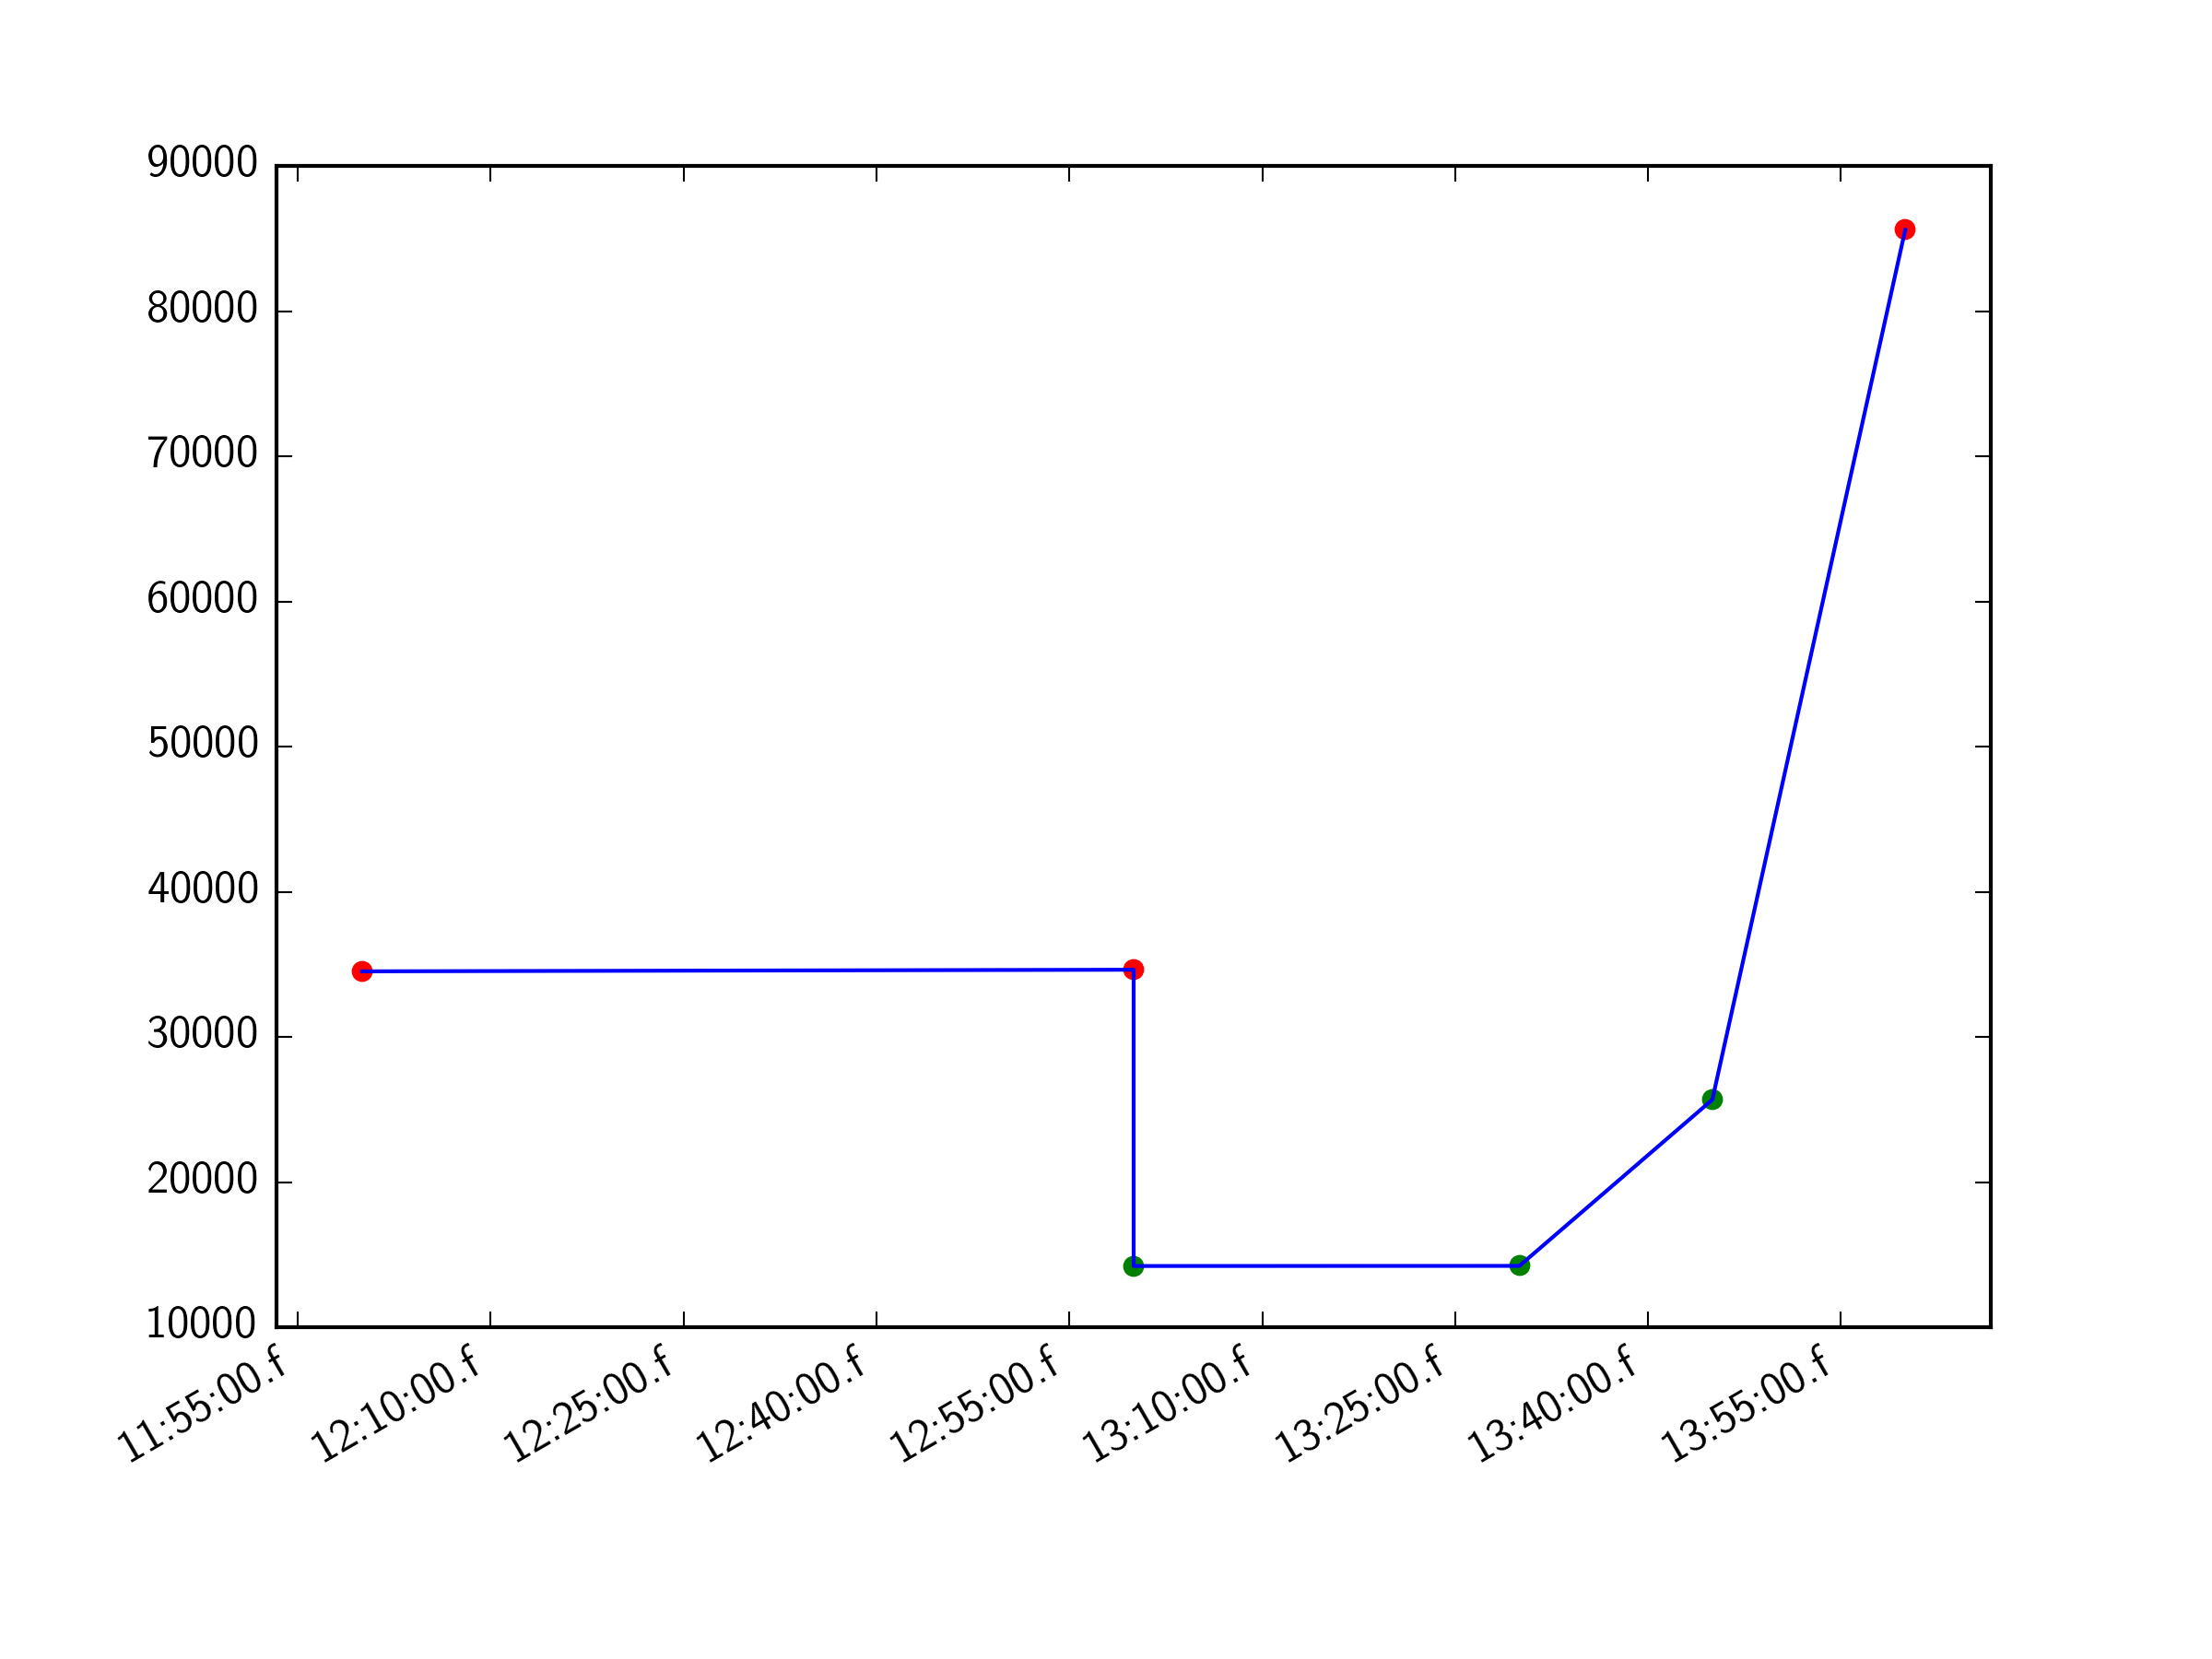
akdj 12:00 34515 sdfg
sgqv 13:00 34626 ssfgb
dfbb 13:00 14215 gghgws
ajdf 13:30 14224 gdgva
dsfb 13:45 25672 FW
sfhh 14:00 85597 adsfb
程序
# ma masked array
import csv
import datetime as dt
import numpy as np
import matplotlib.pyplot as plt
from matplotlib.pyplot import  plot

threshold = 30000
x,y = [],[]
csv_reader = csv.reader(open('Count_Time.csv'))

for line in csv_reader:
    y.append(int(line[2]))
    x.append(dt.datetime.strptime(line[1],'%H:%M'))

#plt.figure()

plt.plot(x,y, color='blue')

#Add below threshold markers
below_threshold = y < threshold
plt.scatter(x[below_threshold], y[below_threshold], color='green')

# Add above threshold markers
above_threshold = np.logical_not(below_threshold)
plt.scatter(x[above_threshold], y[above_threshold], color='red')


plt.show()
错误输出
当我使用下面的代码读取文件时,没有显示任何错误,而是显示了空白的图形布局。
data = np.genfromtxt('Count_Time.csv', delimiter=",")
x = data[:,1]
y = data[:,2]
当以这种方式更改时,将显示以下错误
data = np.loadtxt('Count_Time.csv', delimiter=',', dtype='str, time, int, str')
x = data[:,1]
y = data[:,2]
错误
 data = np.loadtxt('Count_Time.csv', delimiter=',', dtype='str, time, int, str')
  File "/usr/lib/python2.7/dist-packages/numpy/lib/npyio.py", line 798, in loadtxt
    dtype = np.dtype(dtype)
TypeError: data type "time" not understood回答 1
Stack Overflow用户
回答已采纳
发布于 2015-06-15 11:35:10
在计算x和y之前,需要将above_threshold和below_threshold转换为np.array类型,然后才能工作。在您的版本中,您不会得到一个bools数组,而只会得到False和True。
我在输入的csv文件中添加了逗号分隔符以使其工作(我假设应该在这里吗?)
import csv
import datetime as dt
import numpy as np
import matplotlib.pyplot as plt
from matplotlib.pyplot import  plot

threshold = 30000
x,y = [],[]
csv_reader = csv.reader(open('input.csv'))

for line in csv_reader:
    y.append(int(line[2]))
    x.append(dt.datetime.strptime(line[1],'%H:%M'))

fig=plt.figure()

below_threshold = y < threshold
above_threshold = np.logical_not(below_threshold)

print below_threshold
# False

print above_threshold
# True

x=np.array(x)
y=np.array(y)

plt.plot(x,y, color='blue')

#Add below threshold markers
below_threshold = y < threshold
print below_threshold
# [False False  True  True  True False]

plt.scatter(x[below_threshold], y[below_threshold], color='green')

# Add above threshold markers
above_threshold = np.logical_not(below_threshold)
print above_threshold
# [ True  True False False False  True]

plt.scatter(x[above_threshold], y[above_threshold], color='red')

fig.autofmt_xdate()

plt.show()
页面原文内容由Stack Overflow提供。腾讯云小微IT领域专用引擎提供翻译支持
原文链接:
https://stackoverflow.com/questions/30841038
复制相关文章
相似问题
腾讯云开发者
