
双轴叠加-R高图
双轴叠加-R高图
提问于 2015-08-03 15:17:57
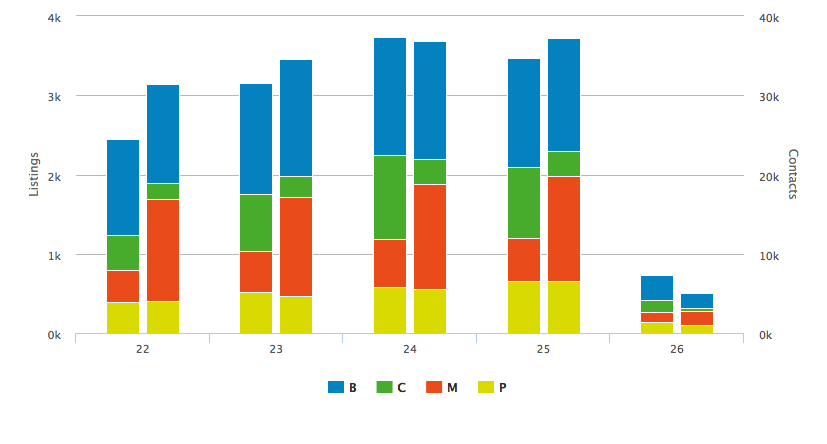
我试图得到一个高图表堆叠在R的双轴条形图,我已经得到了所有的东西,除了堆叠。
资料:我有4个城市在4周内的名单和联系人的数据。
 Week <- c('22', '22', '22', '22', '23', '23', '23', '23', '24', '24', '24', '24', '25', '25', '25', '25', '26', '26', '26', '26')
City <- c("B", "C", "M", "P", "B", "C", "M", "P","B", "C", "M", "P","B", "C", "M", "P","B", "C", "M", "P")
Listings <- c (1213, 442, 400, 395, 1399, 720, 521, 516, 1483, 1062, 608, 582, 1365, 906, 540, 653, 318, 156, 117, 144)
Contacts <- c(12428, 2011, 12923, 4009, 14766, 2589, 12571, 4624, 14793, 3195, 13266, 5554, 14226, 3249, 13273, 6501, 1864, 461, 1773, 975)
lc <- data.frame(Week=Week, City=City, Listings=Listings, Contacts=Contacts)
生成所需输出(堆栈除外)的代码如下所示:
h <- Highcharts$new()
h$xAxis(categories = lc$Week)
h$yAxis(list(list(title = list(text = 'Listings')),
             list(title = list(text = 'Contacts'), opposite = TRUE)))
h$series(name = 'Listings', type = 'column', group = 'City', color = '#4572A7',
        data = lc$Listings)
h$series(name = 'Contacts', type = 'column', group = 'City', color = '#89A54E',
        data = lc$Contacts, yAxis = 1)
h
这里的输出每周有4个列表条(蓝色),每个城市为-> 1。我要把这4堆起来。同样,我也希望4个接触栏被堆叠起来。
谢谢你帮忙!
回答 1
Stack Overflow用户
回答已采纳
发布于 2015-08-03 17:05:48
我认为您需要为每个城市和数据类型定义一个系列。您可以使用一个循环来完成这个任务。在系列选项中,可以将堆栈参数设置为Listings或Contact来堆栈它们。
下面是一个示例:
h <- Highcharts$new()
h$chart(type = "column")
h$plotOptions(column = list(stacking = "normal"),bar = list(colorByPoint = 'true'))
h$xAxis(categories = unique(lc$Week))

h$yAxis(list(list(title = list(text = 'Listings')),
             list(title = list(text = 'Contacts'), opposite = TRUE)))


#add colors manually to each series, so that the listings and contacts
#series have the same color for each city
colors <- list('#058DC7', '#50B432', '#ED561B', '#DDDF00')
names(colors) <- unique(lc$City)

#this loop adds the Listings bars for each city
sapply(unique(lc$City), function(city){
        h$series(id=paste0(city,"listings"),name = city, data = lc[lc$City==city,"Listings"],stack='listing',color=colors[[city]])
})

#this loop adds the Contact bars for each city, the linkedTo parameter is
#set to avoid having  two times the same legend
sapply(unique(lc$City), function(city){
        h$series(name = city,data = lc[lc$City==city,"Contacts"],stack='contacts',yAxis = 1,color=colors[[city]],linkedTo=paste0(city,"listings"))
})
h
页面原文内容由Stack Overflow提供。腾讯云小微IT领域专用引擎提供翻译支持
原文链接:
https://stackoverflow.com/questions/31790962
复制相关文章
相似问题
腾讯云开发者
