
双键DataFrame叠加条形图
双键DataFrame叠加条形图
提问于 2015-10-27 14:11:52
我有一张有两把钥匙的数据。我希望对key2中的条目数做一个堆叠的条形图(这意味着从一个完全填充的数据列中获取计数值)。
我所拥有的数据的一小部分是:
Sector            industry
Basic Industries  Agricultural Chemicals         17
                  Aluminum                        3
                  Containers/Packaging            1
                  Electric Utilities: Central     2
                  Engineering & Construction     12
Name: Symbol, dtype: int64
Key1是部门,Key2是工业。我希望在一个包含基本工业的条形中以符号(计数列表示为行业堆栈)中的值表示。
我知道,如果我做了一个df.reset_index,我会有一个列(非唯一的)扇区和工业的整数计数器。有没有一种方法可以简单地将列1,2,3的数据分配给熊猫地块或matplotlib,以形成一个堆叠的条形图?
或者,是否有一种方法可以轻松地指定使用上述数据帧中的两个键?
我希望从更有经验的人那里获得关于方法的指导,以及对实际语法的帮助。
回答 2
Stack Overflow用户
回答已采纳
发布于 2015-10-27 16:04:02
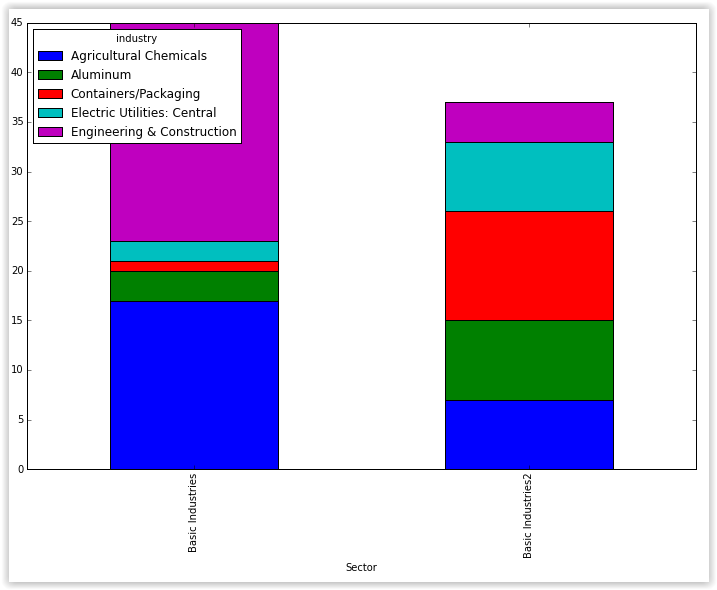
我只是添加了一个新的扇区来改进这个例子。
                                           Symbol
Sector            industry
Basic Industries  Agricultural Chemicals           17
                  Aluminum                          3
                  Containers/Packaging              1
                  Electric Utilities: Central       2
                  Engineering & Construction       22
Basic Industries2 Agricultural Chemicals            7
                  Aluminum                          8
                  Containers/Packaging             11
                  Electric Utilities: Central       7
Engineering & Construction 4假设您的数据是由["Sector", "industry"]索引的,那么首先需要reset_index,然后是数据透视,最后是堆叠的地块。
df.reset_index().pivot_table(index="industry", columns="Sector", values="Symbol").T.plot(kind='bar', stacked=True, figsize=(14, 6))
Stack Overflow用户
发布于 2015-10-27 18:20:30
另一种方法,而不是reset_index,您可以使用以下方法:
df.unstack().Symbol.plot(kind='bar', stacked=True)
页面原文内容由Stack Overflow提供。腾讯云小微IT领域专用引擎提供翻译支持
原文链接:
https://stackoverflow.com/questions/33370289
复制相关文章
相似问题
腾讯云开发者
