
如何在主效应和R的所有交互作用下,在受试者之间进行三重(二元因素)的方差分析
如何在主效应和R的所有交互作用下,在受试者之间进行三重(二元因素)的方差分析
提问于 2015-11-09 08:47:58
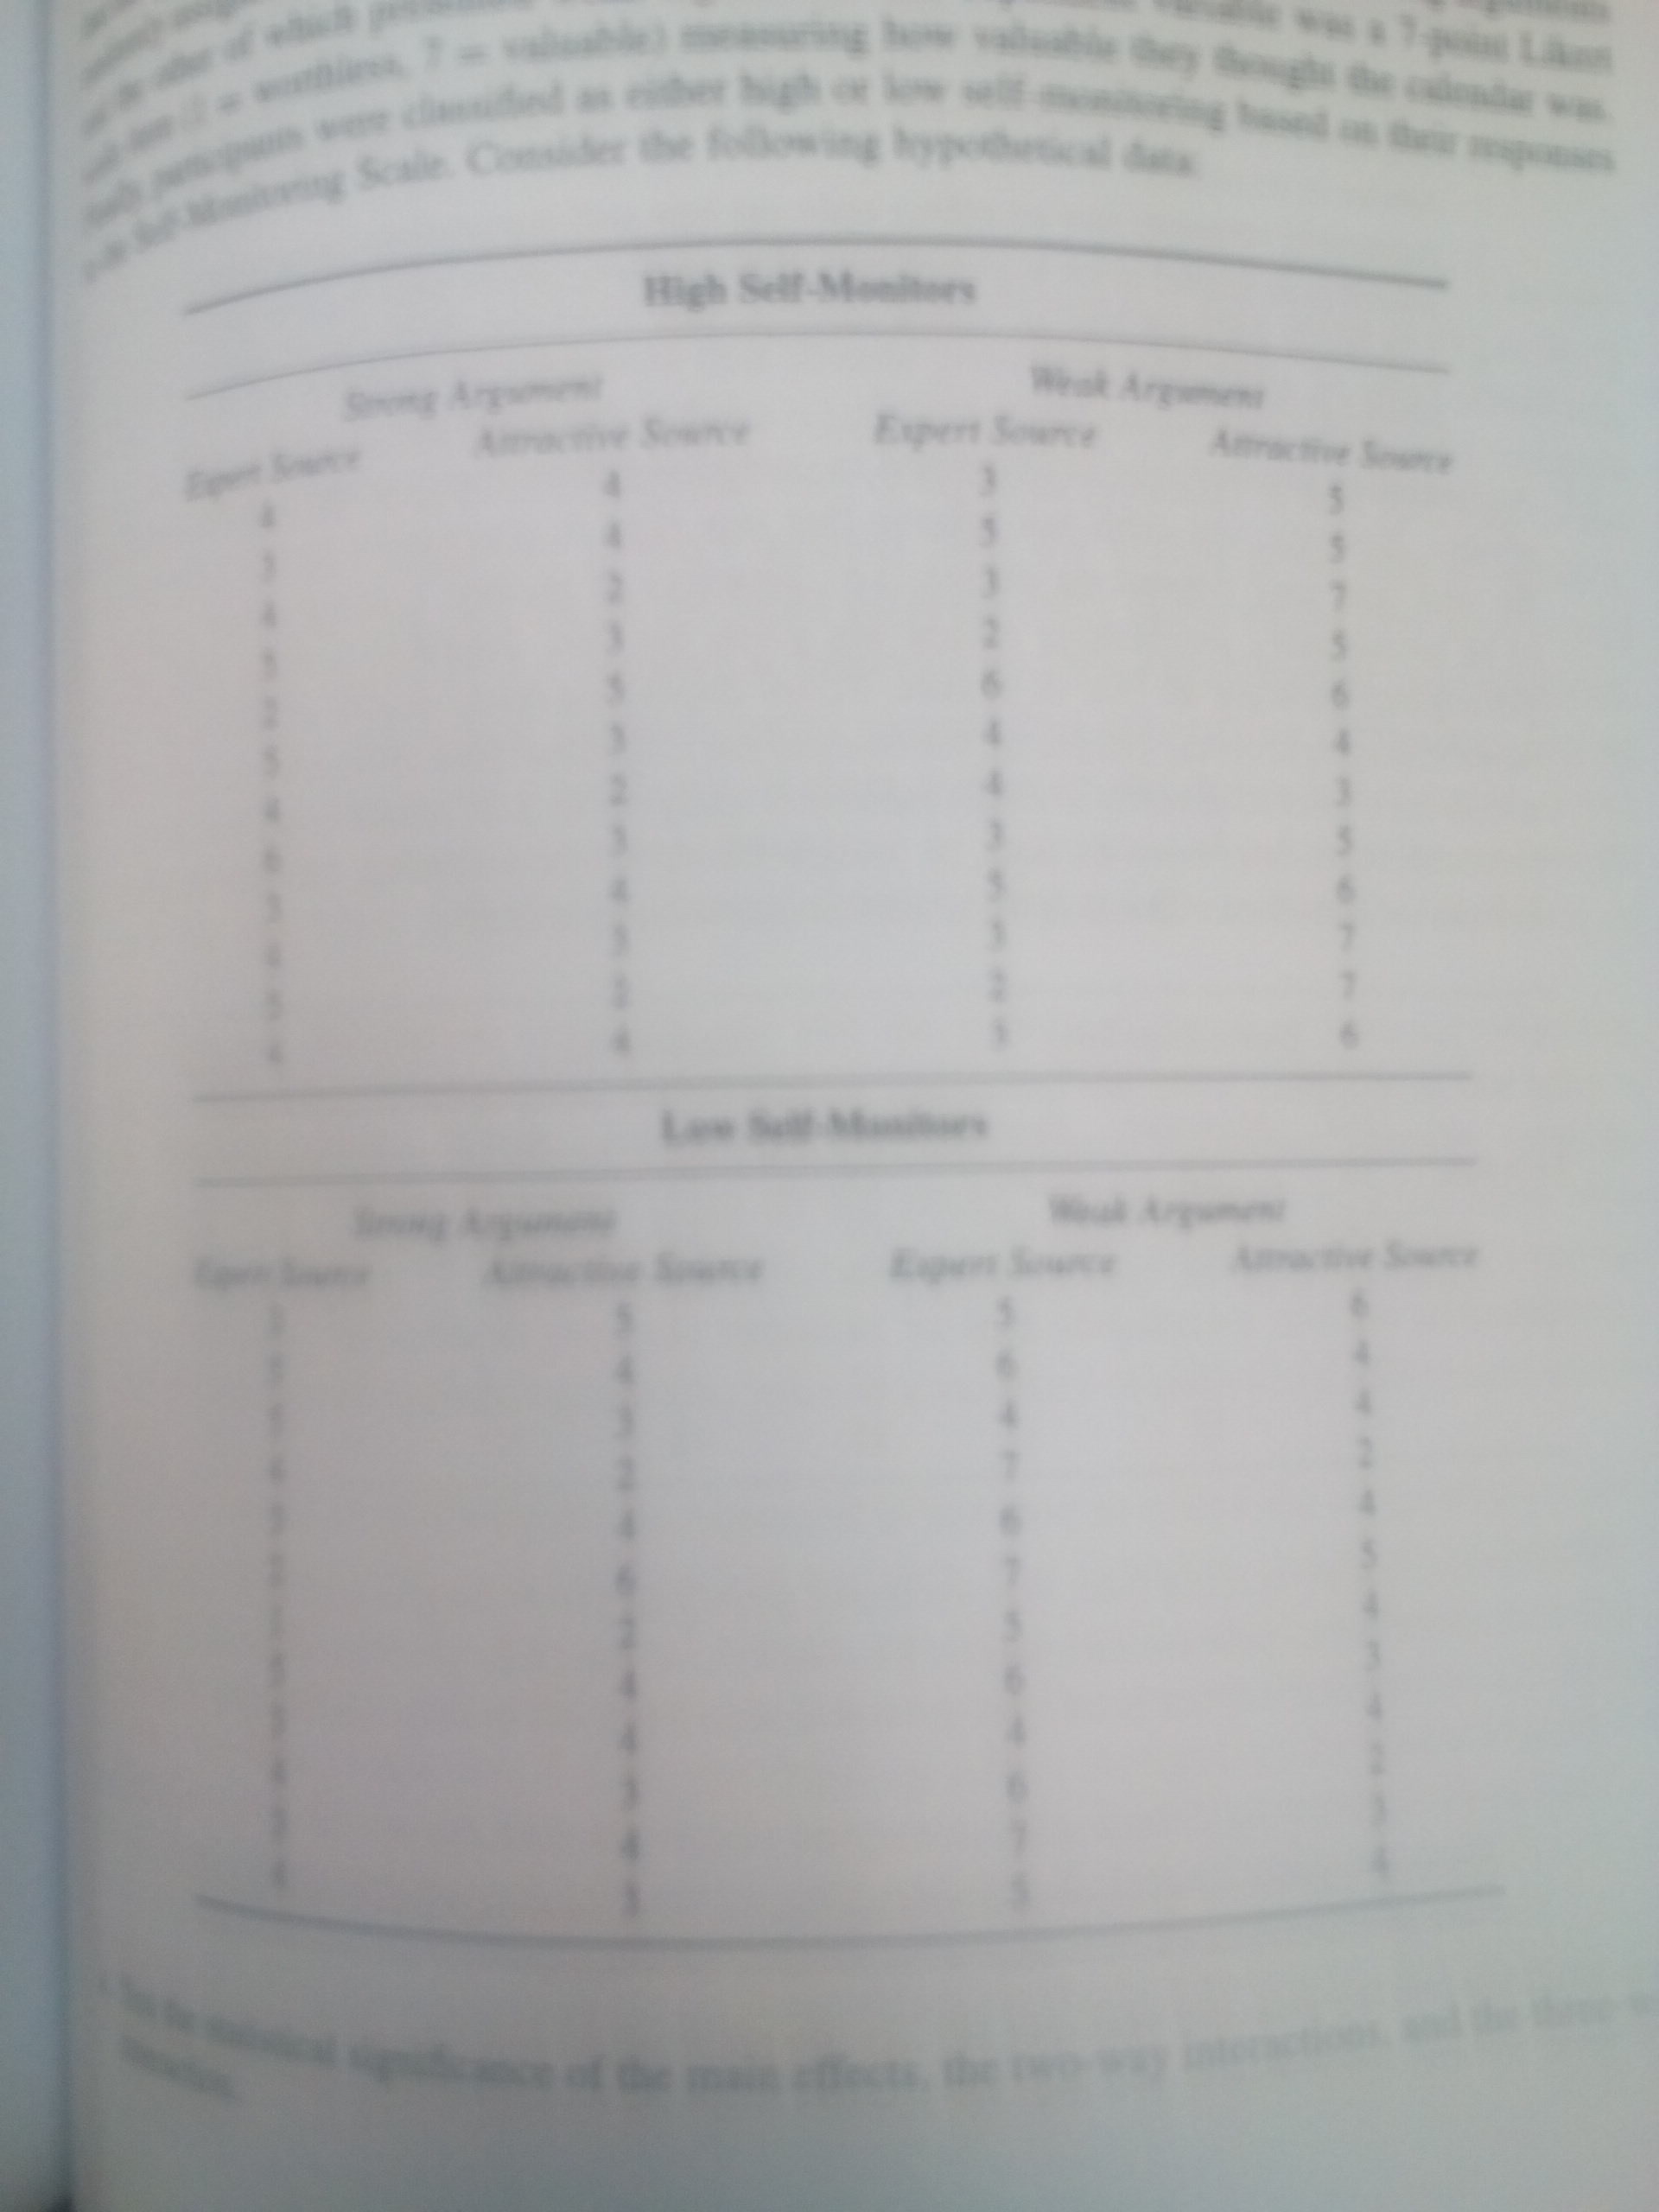
本研究按来源(专家对吸引力)和论点(强与弱)随机分组,分为监视器型(高与低)。我想测试一下主要效应的意义,双向相互作用,以及以下数据的三种交互作用--特别是,
主要效果=自我监控(高与低),争论(强与弱),源(吸引与专家)
双向交互=自监视器_参数,自监视器_源,参数*源
三向交互=自监视器_参数源
这是代码:
data<-data.frame(Monitor=c(rep("High.Self.Monitors", 24),rep("Low.Self.Monitors", 24)),
                 Argument=c(rep("Strong", 24), rep("Weak", 24), rep("Strong", 24), rep("Weak", 24)),
                 Source=c(rep("Expert",12),rep("Attractive",12),rep("Expert",12),rep("Attractive",12),
                          rep("Expert",12),rep("Attractive",12),rep("Expert",12),rep("Attractive",12)),
                 Response=c(4,3,4,5,2,5,4,6,3,4,5,4,4,4,2,3,5,3,2,3,4,3,2,4,3,5,3,2,6,4,4,3,5,3,2,3,5,5,7,5,6,4,3,5,6,7,7,6,
                            3,5,5,4,3,2,1,5,3,4,3,4,5,4,3,2,4,6,2,4,4,3,4,3,5,6,4,7,6,7,5,6,4,6,7,5,6,4,4,2,4,5,4,3,4,2,3,4))
data$Monitor<-as.factor(data$Monitor)
data$Argument<-as.factor(data$Argument)
data$Source<-as.factor(data$Source)我想要获得主要的效果,以及所有的双向互动和三方互动。但是,如果输入anova(lm(Response ~ Monitor*Argument*Source, data=data)),则获得:
Analysis of Variance Table

Response: Response
               Df  Sum Sq Mean Sq F value    Pr(>F)
Monitor         1  24.000 24.0000 13.5322 0.0003947 ***
Source          1   0.667  0.6667  0.3759 0.5413218
Monitor:Source  1   0.667  0.6667  0.3759 0.5413218
Residuals      92 163.167  1.7736
---
Signif. codes: 0 ‘***’ 0.001 ‘**’ 0.01 ‘*’ 0.05 ‘.’ 0.1 ‘ ’ 1如果我进入summary(aov(Response ~ Monitor*Argument*Source, data=data))
Call:
lm.default(formula = Response ~ Monitor * Argument * Source,
    data = data)

Residuals:
    Min      1Q  Median      3Q     Max
-2.7917 -0.7917  0.2083  1.2083  2.5417

Coefficients: (4 not defined because of singularities)
                                                   Estimate Std. Error t value Pr(>|t|)
(Intercept)                                          3.4583     0.2718  12.722  < 2e-16 ***
MonitorLow.Self.Monitors                             1.1667     0.3844   3.035  0.00313 **
ArgumentWeak                                             NA         NA      NA       NA
SourceExpert                                         0.3333     0.3844   0.867  0.38817
MonitorLow.Self.Monitors:ArgumentWeak                    NA         NA      NA       NA
MonitorLow.Self.Monitors:SourceExpert               -0.3333     0.5437  -0.613  0.54132
ArgumentWeak:SourceExpert                                NA         NA      NA       NA
MonitorLow.Self.Monitors:ArgumentWeak:SourceExpert       NA         NA      NA       NA
---
Signif. codes:  0 ‘***’ 0.001 ‘**’ 0.01 ‘*’ 0.05 ‘.’ 0.1 ‘ ’ 1

Residual standard error: 1.332 on 92 degrees of freedom
Multiple R-squared:  0.1344,    Adjusted R-squared:  0.1062
F-statistic: 4.761 on 3 and 92 DF,  p-value: 0.00394
有什么想法或想法吗?
编辑
回答 1
Stack Overflow用户
发布于 2015-11-09 09:30:35
你的数据并不像你说的那样是随机的。为了估计三种因素的交互作用,你必须有一组“低”、“强”和“专家”三种因素的组合。你没有这样的团体。
看:
table(data[,1:3])例如。
页面原文内容由Stack Overflow提供。腾讯云小微IT领域专用引擎提供翻译支持
原文链接:
https://stackoverflow.com/questions/33605362
复制相关文章
相似问题
腾讯云开发者
