
有没有一种快速的方法来填充R中的曲线?
有没有一种快速的方法来填充R中的曲线?
提问于 2015-11-25 00:48:55
我熟悉polygon和ggplot2,但我喜欢使用基本plot。
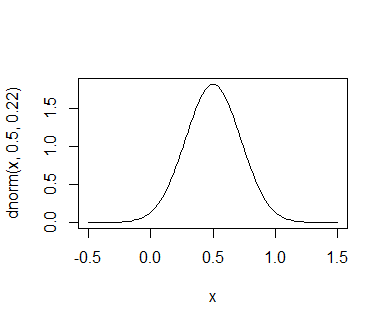
我想填写命令调用的曲线:
curve(dnorm(x, 0.5, 0.22), xlim=c(-0.5, 1.5))
当我在过去使用polygon时,我根据以前按照x <- seq(-0.5, 0.5, len = 100)和y <- dnorm(x, 0.5, 0.22)的思路对x进行的计算定义了端点。接下来,在polygon中定义限制,选择的颜色,等等.在不到两周的时间里,有颜色.
好的,不是很快,但在这个特殊情况下,我甚至没有在x和y之外显式定义curve,这使得整个过程更加繁琐。就像重新开始一样。
是否有任何方法可以快速完成,例如fill、col或curve中的其他绘图参数
Stack Overflow用户
回答已采纳
发布于 2015-11-25 01:01:50
实际上,您可以相对轻松地修改curve函数。我所做的唯一改变是:
1)将默认的fill参数添加到"red“
2)在函数末尾添加一个polygon图(标记为注释)
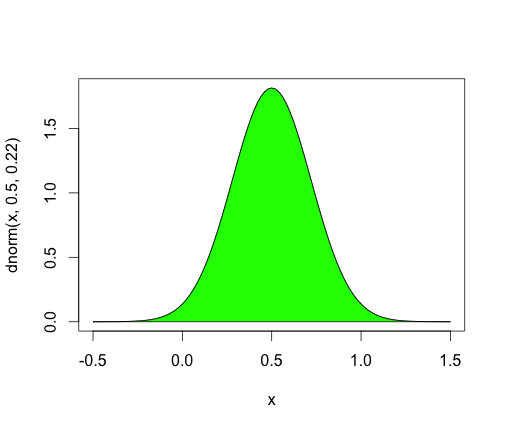
这是起作用的函数。有关函数代码,请参见下面的内容。
my_curve(dnorm(x, 0.5, 0.22), xlim=c(-0.5, 1.5), fill="green")
我不确定这是否比仅仅这样做更有利:
x=seq(-0.5,1.5,0.01)
plot(x, dnorm(x,0.5,0.22), xlim=c(-0.5,1.5), type="l")
polygon(x, dnorm(x,0.5,0.22), col="green")但是,如果要大量使用它,可以在脚本中使用my_curve,或者使用新版本的curve创建一个包,该包可以屏蔽基本版本。您还可以使fill成为可选的,也许还可以添加允许部分填充的特性。
如果您对ggplot2的默认设置不感兴趣,您也可以去掉它们,同时仍然保留ggplot语法的好处:
library(ggplot2)

df = data.frame(x=seq(-0.5,1.5,0.01), y=dnorm(x,0.5,0.22))

ggplot(df, aes(x,y)) +
  geom_area(colour="black", fill="red") +
  theme_bw() +
theme(panel.grid=element_blank())下面是修改后的curve函数:
my_curve = function (expr, from = NULL, to = NULL, n = 101, add = FALSE,
                     type = "l", xname = "x", xlab = xname, ylab = NULL, log = NULL,
                     xlim = NULL, fill="red", ...)
{
  sexpr <- substitute(expr)
  if (is.name(sexpr)) {
    expr <- call(as.character(sexpr), as.name(xname))
  }
  else {
    if (!((is.call(sexpr) || is.expression(sexpr)) && xname %in%
          all.vars(sexpr)))
      stop(gettextf("'expr' must be a function, or a call or an expression containing '%s'",
                    xname), domain = NA)
    expr <- sexpr
  }
  if (dev.cur() == 1L && !identical(add, FALSE)) {
    warning("'add' will be ignored as there is no existing plot")
    add <- FALSE
  }
  addF <- identical(add, FALSE)
  if (is.null(ylab))
    ylab <- deparse(expr)
  if (is.null(from) || is.null(to)) {
    xl <- if (!is.null(xlim))
      xlim
    else if (!addF) {
      pu <- par("usr")[1L:2L]
      if (par("xaxs") == "r")
        pu <- extendrange(pu, f = -1/27)
      if (par("xlog"))
        10^pu
      else pu
    }
    else c(0, 1)
    if (is.null(from))
      from <- xl[1L]
    if (is.null(to))
      to <- xl[2L]
  }
  lg <- if (length(log))
    log
  else if (!addF && par("xlog"))
    "x"
  else ""
  if (length(lg) == 0)
    lg <- ""
  if (grepl("x", lg, fixed = TRUE)) {
    if (from <= 0 || to <= 0)
      stop("'from' and 'to' must be > 0 with log=\"x\"")
    x <- exp(seq.int(log(from), log(to), length.out = n))
  }
  else x <- seq.int(from, to, length.out = n)
  ll <- list(x = x)
  names(ll) <- xname
  y <- eval(expr, envir = ll, enclos = parent.frame())
  if (length(y) != length(x))
    stop("'expr' did not evaluate to an object of length 'n'")
  if (isTRUE(add))
    lines(x = x, y = y, type = type, ...)
  else plot(x = x, y = y, type = type, xlab = xlab, ylab = ylab,
            xlim = xlim, log = lg, ...)
       polygon(x,y, col=fill)  # Add filled area under curve
  invisible(list(x = x, y = y))
}页面原文内容由Stack Overflow提供。腾讯云小微IT领域专用引擎提供翻译支持
原文链接:
https://stackoverflow.com/questions/33906665
复制相关文章
相似问题
腾讯云开发者
