
如何将HoverTool添加到数据表(Bokeh,Python)
如何将HoverTool添加到数据表(Bokeh,Python)
提问于 2015-12-09 01:33:09
回答 2
Stack Overflow用户
回答已采纳
发布于 2017-07-20 16:42:55
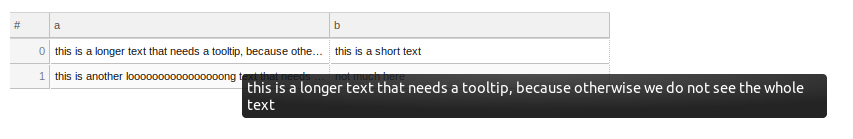
这是可以使用HTMLTemplateFormatter的
main.py
from os.path import dirname, join
import pandas as pd
from bokeh.io import curdoc, show
from bokeh.models import ColumnDataSource, Div
from bokeh.models.widgets import DataTable, TableColumn, HTMLTemplateFormatter
from bokeh.layouts import layout

template = """<span href="#" data-toggle="tooltip" title="<%= value %>"><%= value %></span>"""

df = pd.DataFrame([
    ['this is a longer text that needs a tooltip, because otherwise we do not see the whole text', 'this is a short text'],
    ['this is another loooooooooooooooong text that needs a tooltip', 'not much here'],
], columns=['a', 'b'])

columns = [TableColumn(field=c, title=c, width=20, formatter=HTMLTemplateFormatter(template=template)) for c in ['a', 'b']]

table = DataTable(source=ColumnDataSource(df), columns=columns)

l = layout([[table]])

curdoc().add_root(l)

show(l)
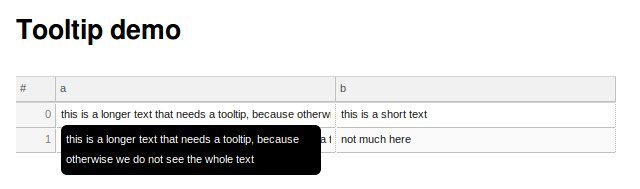
一个稍微好一点的方法(虽然有点痛苦)将使用一个不同的模板与一些CSS样式。
template = """<div class="tooltip-parent"><div class="tooltipped"><%= value %></div><div class="tooltip-text"><%= value %></div></div>"""desc.html
<style>
.tooltip-parent {
    width: 100%;
}

.tooltipped {
    overflow: hidden;
    width: 100%;
}

.tooltip-text {
    visibility: hidden;
    width: 250px;
    background-color: rgba(0, 0, 0, 1);
    color: #fff;
    text-align: center;
    border-radius: 6px;
    padding: 5px 5px;
    position: relative;
    z-index: 1;
    top: 100%;
    left: 0%;
    white-space: initial;
    text-align: left;
}

.tooltipped:hover + .tooltip-text {
    visibility: visible;
}

div.bk-slick-cell {
    overflow: visible !important;
    z-index: auto !important;
}
</style>

<h1>Tooltip demo</h1>
Stack Overflow用户
发布于 2017-01-17 02:41:41
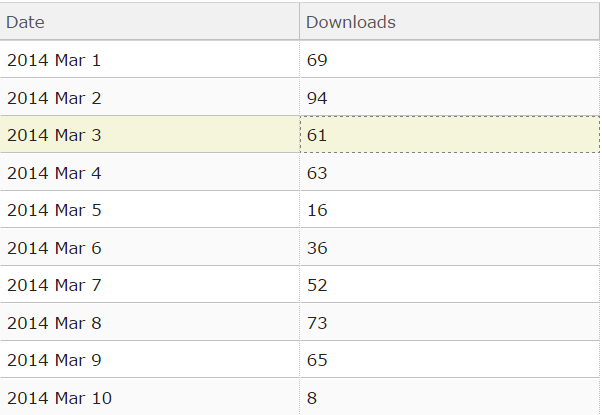
尝试将熊猫DataFrame转换为html,然后在调用它时使用自定义bokeh工具提示中的{safe}标记。下面的示例可以在最新的bokeh上运行(建于github,但稍后可以通过pip获得)。
import datetime
import numpy as np
import pandas as pd
from bokeh.io import show, output_notebook
from bokeh.plotting import ColumnDataSource, figure
from bokeh.models import HoverTool, Range1d
# Create dataframe of dates and random download numbers.
startdate = datetime.datetime.now()
nextdate = lambda x:startdate+datetime.timedelta(x)
value = 10
dates = [nextdate(i) for i in range(value)]
downloads = np.random.randint(0,1000,value)
data = np.array([dates,downloads]).T
data = pd.DataFrame(data,columns = ["Date","Downloads"])
data["Date"] = data.Date.apply(lambda x:"{:%Y %b %d}".format(x))
# Convert dataframe to html
data_html = data.to_html(index=False)
output_notebook()
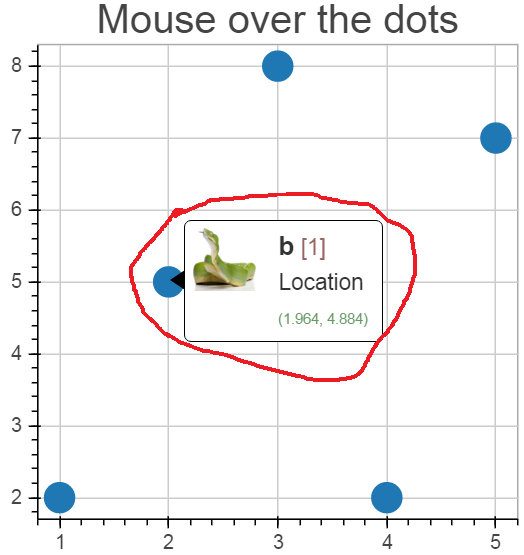
fig = figure(x_range=(0, 5), y_range=(0, 5),tools=[HoverTool(tooltips="""@html{safe}""")])
source=ColumnDataSource(data=dict(x=[1,3],
y=[2,4],
html=["<b>Some other html.</b>", data_html]))
fig.circle('x', 'y', size=20, source=source)
show(fig)如果您想要一个您可以更容易地样式的表,这里有一个使用独占的例子,这个html生成包:
import datetime
import numpy as np
import pandas as pd
from dominate.tags import *

%env BOKEH_RESOURCES=inline
from collections import OrderedDict
from bokeh.plotting import figure
from bokeh.models import ColumnDataSource, HoverTool, TapTool, OpenURL
# For displaying in jupyter notebook
from bokeh.io import push_notebook,show,output_notebook
from bokeh.resources import INLINE
output_notebook(resources=INLINE)

# Create dataframe of dates and random download numbers.
startdate = datetime.datetime.now()
nextdate = lambda x:startdate+datetime.timedelta(x)

value = 5

dates = [nextdate(i) for i in range(value)]
downloads = np.random.randint(0,1000,value)
data = np.array([dates,downloads]).T
data = pd.DataFrame(data,columns = ["Date","Downloads"])
data["Date"] = data.Date.apply(lambda x:"{:%Y %b %d}".format(x))

# STYLES
header_style = ["border:1px solid black",
                "font-size:10px",
                "font-weight:bold",
                "color:black",
                "padding:3px",
               ]

header_style = ";".join(header_style)+";"

td_style = ["border: 1px solid black",
            "font-size:10px",
            "padding:3px",]

td_style = ";".join(td_style)+";"

# Create HTML table
my_table = table()
my_table.add(tr([th(i,style=header_style) for i in data.columns]))

[my_table.add(tr([td("{}".format(j),style=td_style) for j in i])) for i in data.values]

# Create figure
fig = figure(x_range=(0, 5), y_range=(0, 5),tools=[HoverTool(tooltips="""@html{safe}""")])

source=ColumnDataSource(data=dict(x=[1,3],
                                  y=[2,4],
                                  html=["<b>Some other html.</b>", my_table.render()]))

fig.circle('x', 'y', size=20, source=source)

show(fig)页面原文内容由Stack Overflow提供。腾讯云小微IT领域专用引擎提供翻译支持
原文链接:
https://stackoverflow.com/questions/34169264
复制相关文章
相似问题
腾讯云开发者
