
每次按下Matlab按钮更新图
每次按下Matlab按钮更新图
提问于 2016-01-08 23:01:37
我开发了一个GUI来跟踪一个博彩基金。它告诉你相对于你的基金规模要赌多少钱。它的基础是,它有两个按钮,要么赢,要么输。每次按压,它都会更新基金的大小,并告诉你要赌什么(10%),如果输赢率是双倍还是零。
下面的图片就是一个例子。如果最初的基金是be 1000,我们让赢是= 1,损失=0
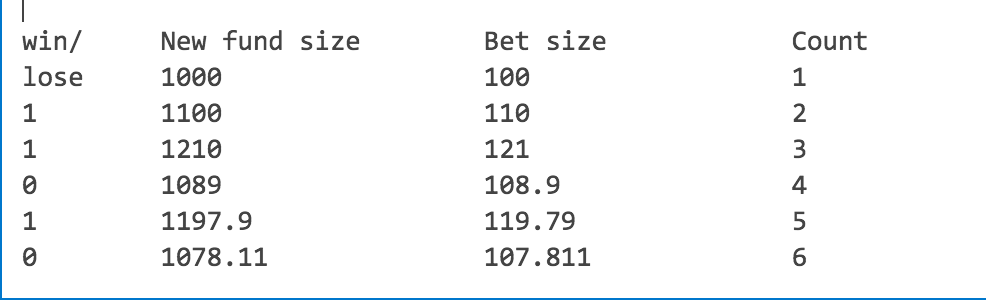
当按下按钮时,它只显示新的基金规模和押注规模。我正在寻找一种方法来绘制结果,这样它将绘制所有的newFundSize (y轴)与计数(x轴),因此它将向您展示您的基金规模是如何随着时间的推移而变化的(投注数量)。
它目前将x轴更改为正确的长度,x1 = linspace(1:currentCount)。对于Y值,我只记得以前的基金规模和新的基金规模。
是否有可能以某种方式绘制所有新的基金规模数据?或者存储所有以前的基金规模值?
另外,它有一种方式来存储订单和次数,多少次按下输赢按钮?
例如,赢,赢,输,赢,赢,输,赢,
谢谢。
回答 1
Stack Overflow用户
回答已采纳
发布于 2016-01-10 05:36:52
是的,可以在MATLAB中存储所有这些信息。有几种方法可以做到这一点,但最好的方法通常是将数据存储在图形本身内。您可以使用制导数据、setappdata和getappdata或图形的UserData属性来完成此操作。
下面有一个使用setappdata方法的示例,其中我将信息存储在一个数据结构中,该数据结构是具有以下形式的结构数组
data =

      win: true    % Logical indicating whether it was a winning bet
     fund: 1000    % Amount of money in the fund
    count: 0       % The number of bets placed so far (optional)
每次用户下注时,我都会将上述格式的另一个结构附加到数据结构中。
以下是完整的例子。
function data = bet(initialFund, betPercentage)
    if ~exist('initialBet', 'var')
        initialFund = 1000;
    end

    if ~exist('betPercentage', 'var')
        betPercentage = 10;
    end

    % The data structure that we will use to keep track of the bets
    data = struct('win', NaN, 'fund', initialFund, 'count', 0);

    % Now create the figure and the plot that you want
    fig = figure();

    hax = axes(...
        'Parent', fig, ...
        'Units', 'normalized', ...
        'Position', [0.15 0.35 0.7 0.6]);

    % Plot to display current fund data
    plt = plot(NaN, NaN, 'Parent', hax);

    xlabel(hax, 'Bet', 'FontWeight', 'bold', 'FontSize', 18)
    ylabel(hax, 'Fund ($)', 'FontWeight', 'bold', 'FontSize', 18)

    set(hax, 'FontWeight', 'bold')

    % Create a button to place a winning and losing bet
    uicontrol(fig, ...
        'String', 'Place Winning Bet', ...
        'Units', 'normalized', ...
        'Position', [0.01 0.01 0.45 0.2], ...
        'Callback', @(s,e)place_bet(true, betPercentage/100));

    uicontrol(fig, ...
        'String', 'Place Losing Bet', ...
        'Units', 'normalized', ...
        'Position', [0.5 0.01 0.45 0.2], ...
        'Callback', @(s,e)place_bet(false, betPercentage/100));

    % Store the data within the handle
    setappdata(fig, 'BetData', data)

    % Plot the initial bet data
    refreshPlot(data);

    function place_bet(win_lose, percentage)
        % Determine whether we win or lose
        data = getappdata(fig, 'BetData');

        % Now add the new data
        lastbet = data(end);

        % Compute the new fund based on the bet amount
        newfund = (1 - ((-1)^win_lose) * percentage) * lastbet.fund;

        newdata = struct(...
            'win', win_lose, ...
            'fund', newfund, ...
            'count', lastbet.count + 1);

        data = cat(1, data, newdata);

        % Store the updated data
        setappdata(fig, 'BetData', data)

        % Now update the plot
        refreshPlot(data);
    end

    function refreshPlot(data)
        set(plt, 'XData', [data.count], 'YData', [data.fund])
        set(hax, 'XLim', [data(1).count, max(data(end).count, 10)])
    end
end页面原文内容由Stack Overflow提供。腾讯云小微IT领域专用引擎提供翻译支持
原文链接:
https://stackoverflow.com/questions/34687517
复制相关文章
相似问题
腾讯云开发者
