
如果y列的线条样式发生变化,则在多重图中更改网格线。
如果y列的线条样式发生变化,则在多重图中更改网格线。
提问于 2016-01-09 04:24:51
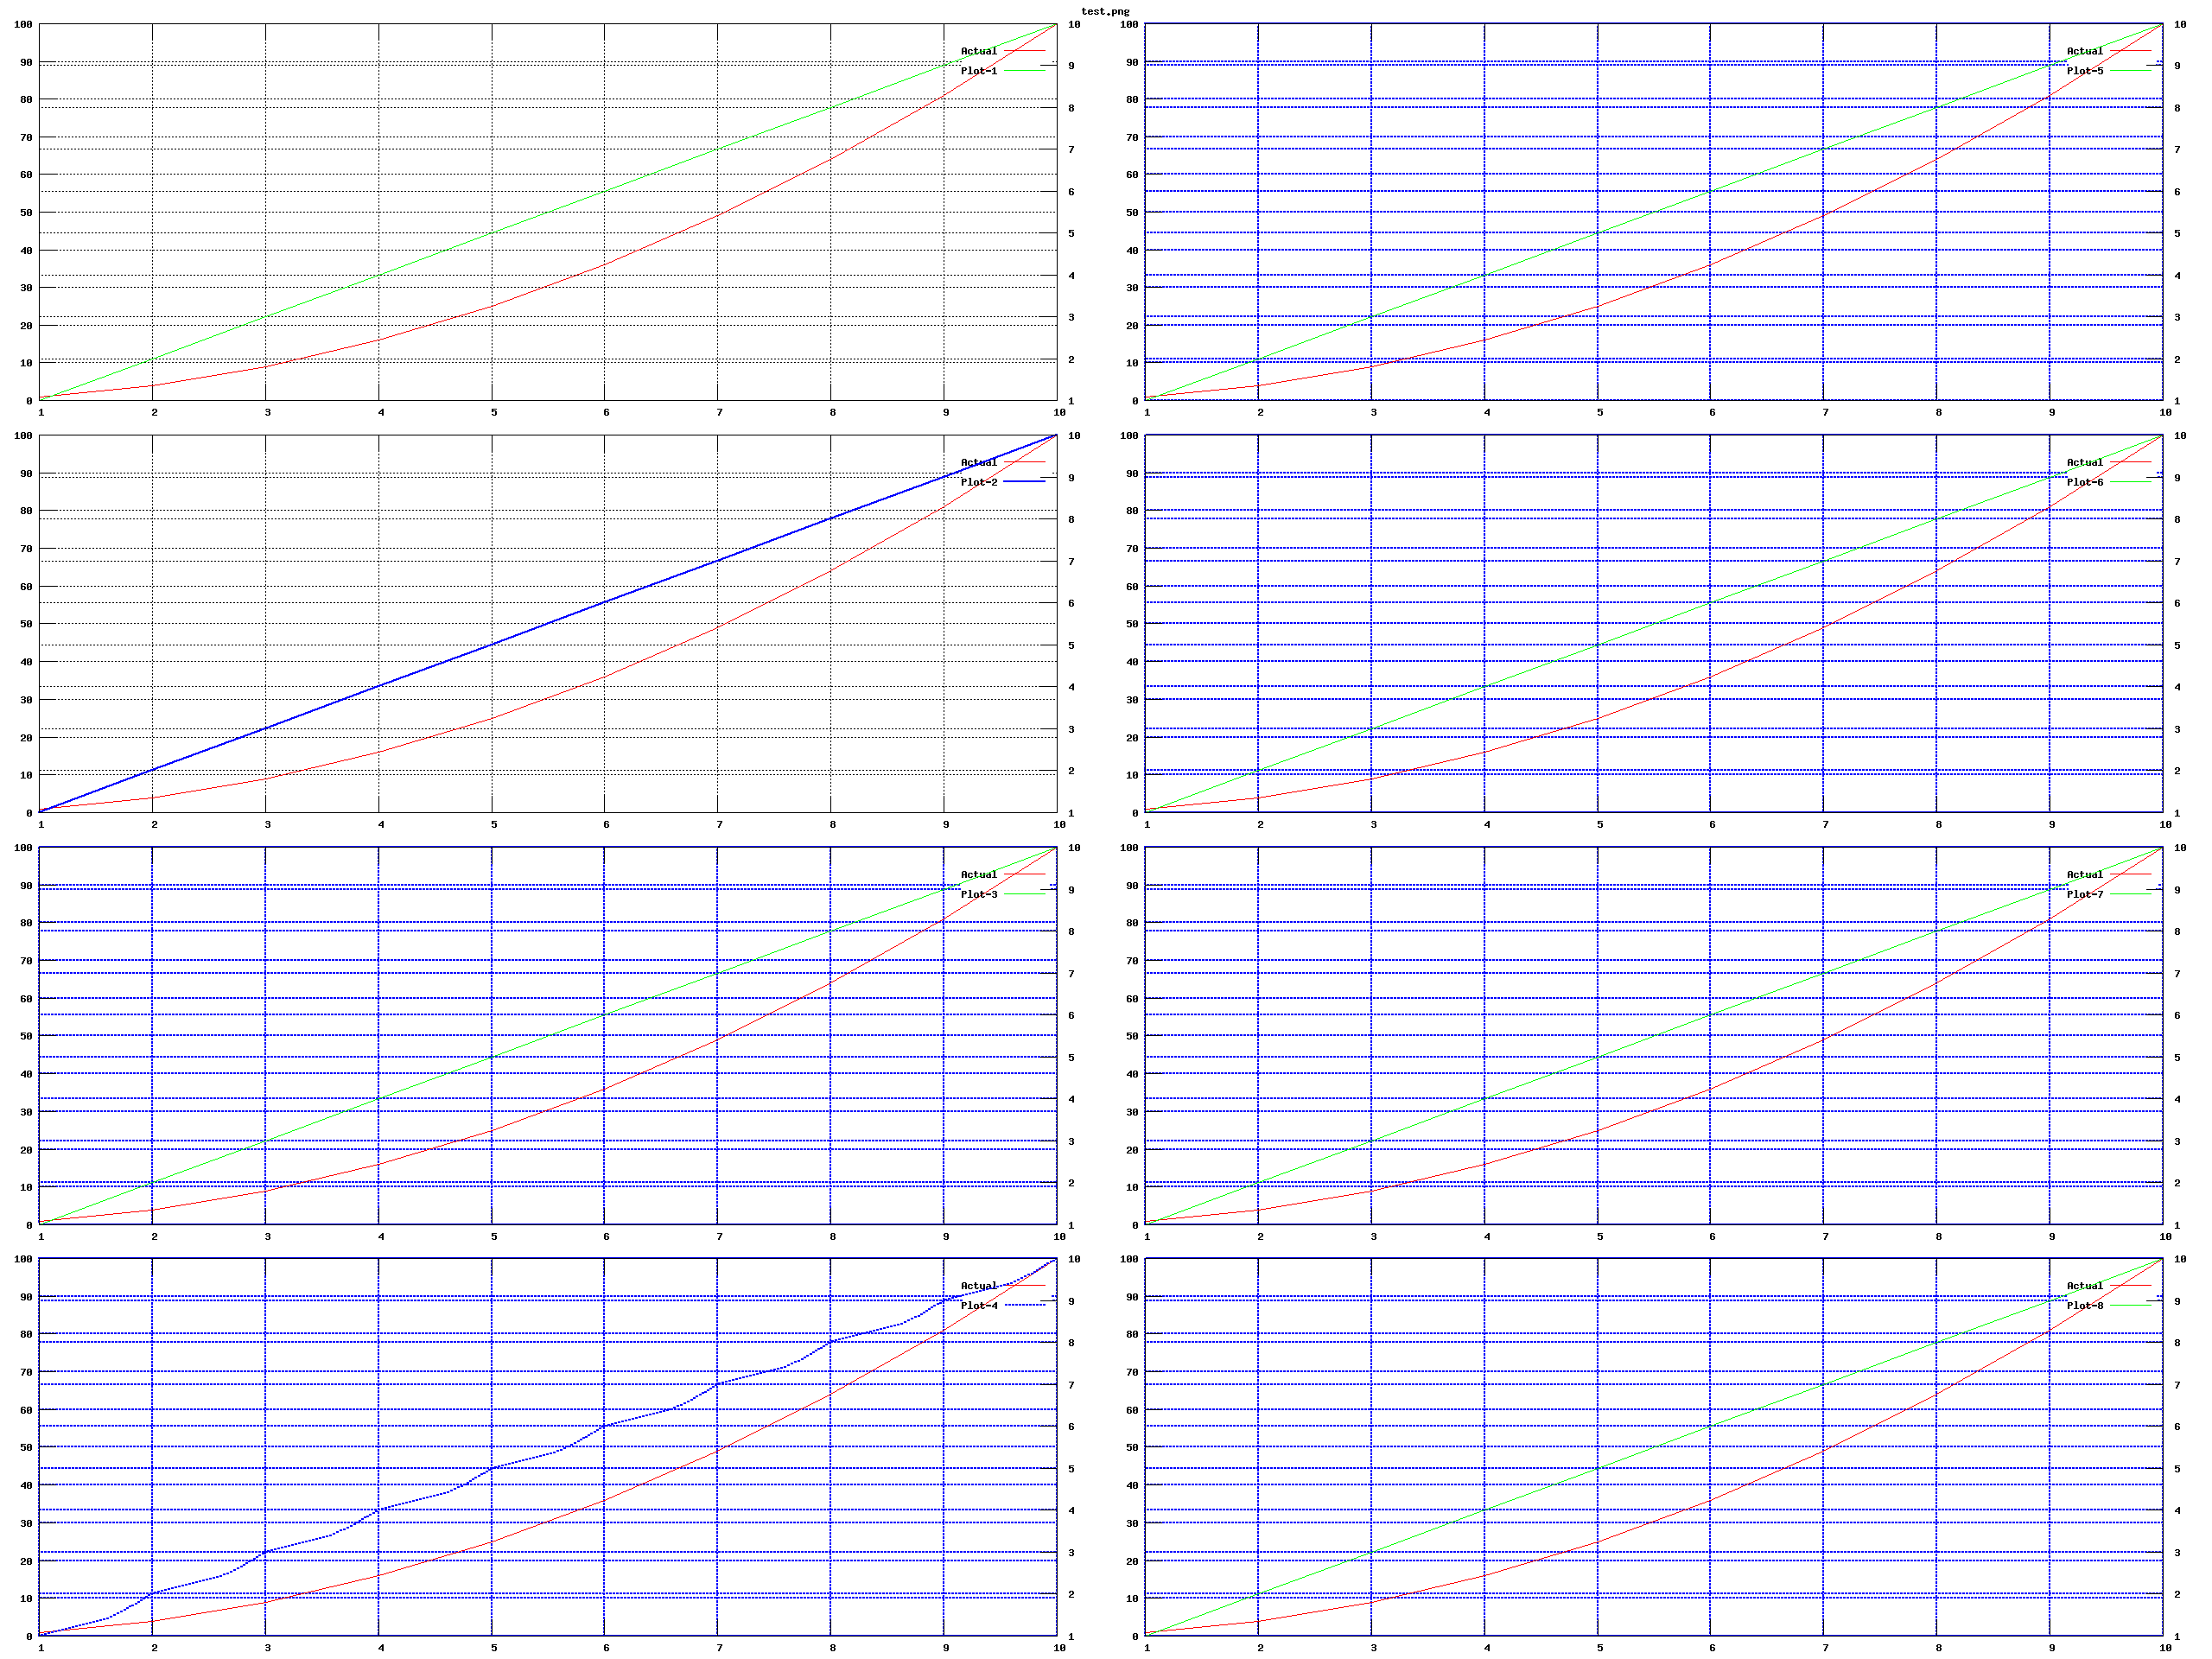
我试图在png文件中绘制多个情节。多重图有8个图元。每幅图都有两个y轴,网格将用ls 0显示.一切都很好,直到我改变了一个情节的线宽。当我在绘图中直接更改线型或线宽时,其余图形中的网格将以新的线宽和颜色显示。我在Windows 7 MinGW中使用GNU绘图版本5。
我已经尝试过在网格中设置行样式,如下所示:
- set style line 4 lc rgb 'black' lt 0 set grid xtics ytics y2tics ls 4
- 在绘图时设置线宽,如下所示: input_filename使用11:9和线轴x1y2 lc rgb‘绿色’lw2标题‘plt-5’
但什么都不管用。以下是完整的代码:
#----------------
#input variables
#----------------
#input_filename
#png_filename


#----------------
# Sample Command:
#
#   gnuplot -e "input_filename='test.csv'" -e "png_filename='test.png'" gnuplotMultiSample_A.plt
#
#----------------


#----------------
# Code Starts
#----------------

reset

set datafile separator ","
set term png
set output png_filename

set size 1,2
set terminal png size 2560,1920

    set ytics nomirror
    set y2tics


    set multiplot layout 4,2 columnsfirst title png_filename

        set style line 1 lc rgb 'red' lt 3
        set style line 2 lc rgb 'blue' lt 2 lw 2
        set style line 3 lc rgb 'green' lt 1
        set style line 4 lc rgb 'black' lt 0


        unset grid
        #set grid xtics ytics y2tics lt 0  lc rgb "#880000"
        set grid xtics ytics y2tics ls 4

        plot input_filename using 11:12 with lines axes x1y1 ls 1 title 'Actual', \
                                    input_filename using 11:1 with lines axes x1y2 lc rgb 'green' title 'Plot-1'

        plot input_filename using 11:12 with lines axes x1y1 ls 1 title 'Actual', \
                                    input_filename using 11:3 with lines axes x1y2 ls 2 title 'Plot-2'

        plot input_filename using 11:12 with lines axes x1y1 ls 1 title 'Actual', \
                                    input_filename using 11:5 with lines axes x1y2 ls 3 title 'Plot-3'

        plot input_filename using 11:12 with lines axes x1y1 ls 1 title 'Actual', \
                                    input_filename using 11:7 with lines axes x1y2 ls 4 title 'Plot-4'


        plot input_filename using 11:12 with lines axes x1y1 ls 1 title 'Actual', \
                                    input_filename using 11:9 with lines axes x1y2 lc rgb 'green' title 'Plot-5'

        plot input_filename using 11:12 with lines axes x1y1 ls 1 title 'Actual', \
                                    input_filename using 11:11 with lines axes x1y2 lc rgb 'green' title 'Plot-6'

        plot input_filename using 11:12 with lines axes x1y1 ls 1 title 'Actual', \
                                    input_filename using 11:1 with lines axes x1y2 lc rgb 'green' title 'Plot-7'

        plot input_filename using 11:12 with lines axes x1y1 ls 1 title 'Actual', \
                                    input_filename using 11:3 with lines axes x1y2 lc rgb 'green' title 'Plot-8'

        unset grid

    unset multiplot
和pngcairo合作。下面是供参考的最终代码。谢谢Schorsch。
#----------------
#input variables
#----------------
#input_filename
#png_filename


#----------------
# Sample Command:
#
#   gnuplot -e "input_filename='test.csv'" -e "png_filename='test.png'" gnuplotMultiSample_A.plt
#
#----------------


#----------------
# Code Starts
#----------------

reset


set term pngcairo size 2560,1920
#set terminal pngcairo dashed
#set termoption dashed

set datafile separator ","
#set term png
set output png_filename

set size 1,2
#set terminal png size 2560,1920

    set ytics nomirror
    set y2tics


    set multiplot layout 4,2 columnsfirst title png_filename

        set style line 81 lc rgb 'red' lt 3 lw 1
        set style line 82 lc rgb 'blue' lt 2 lw 2
        set style line 83 lc rgb 'green' lt 1 lw 1
        set style line 84 lc rgb 'black' lt 0 lw 1


        unset grid
        #set grid xtics ytics y2tics lt 0  lc rgb "#880000"
        #set grid xtics ytics y2tics lt 1 lw 1 lc rgb "#880000"
                                        # Line type 1 works for Png but not lt 0. As per the guidelines
                                        # trying using "set terminal pngcairo dashed" as per the site:
                                        #           http://stackoverflow.com/questions/19412382/gnuplot-line-types/19420678#19420678
                                        #           http://stackoverflow.com/questions/34689654/grid-lines-are-changed-in-multiplot-if-lines-styles-of-y-column-is-changed/34751992#34751992
        set grid xtics ytics y2tics lt 0 lw 1 lc rgb "#880000"

        plot input_filename using 11:12 with lines axes x1y1 ls 81 title 'Actual', \
                                    input_filename using 11:1 with lines axes x1y2 lc rgb 'green' title 'Plot-1'

        plot input_filename using 11:12 with lines axes x1y1 ls 81 title 'Actual', \
                                    input_filename using 11:3 with lines axes x1y2 ls 82 title 'Plot-2'

        plot input_filename using 11:12 with lines axes x1y1 ls 81 title 'Actual', \
                                    input_filename using 11:5 with lines axes x1y2 ls 83 title 'Plot-3'

        plot input_filename using 11:12 with lines axes x1y1 ls 81 title 'Actual', \
                                    input_filename using 11:7 with lines axes x1y2 ls 84 title 'Plot-4'


        plot input_filename using 11:12 with lines axes x1y1 ls 81 title 'Actual', \
                                    input_filename using 11:9 with lines axes x1y2 lc rgb 'green' title 'Plot-5'

        plot input_filename using 11:12 with lines axes x1y1 ls 81 title 'Actual', \
                                    input_filename using 11:11 with lines axes x1y2 lc rgb 'green' title 'Plot-6'

        plot input_filename using 11:12 with lines axes x1y1 ls 81 title 'Actual', \
                                    input_filename using 11:1 with lines axes x1y2 lc rgb 'green' title 'Plot-7'

        plot input_filename using 11:12 with lines axes x1y1 ls 81 title 'Actual', \
                                    input_filename using 11:3 with lines axes x1y2 lc rgb 'green' title 'Plot-8'

        unset grid

unset multiplot回答 1
Stack Overflow用户
回答已采纳
发布于 2016-01-12 19:16:14
我相信你的问题与你设定的线条风格有关:
set style line 1 lc rgb 'red' lt 3
set style line 2 lc rgb 'blue' lt 2 lw 2
set style line 3 lc rgb 'green' lt 1
set style line 4 lc rgb 'black' lt 0由于有预定义的线条样式,这些样式可能无法正常工作,最终会使您的网格线在多重绘图环境中混乱。更具体地说,是选项lw 2打破了您的网格线。
对于 output,您可以看到有80种预定义的行样式:
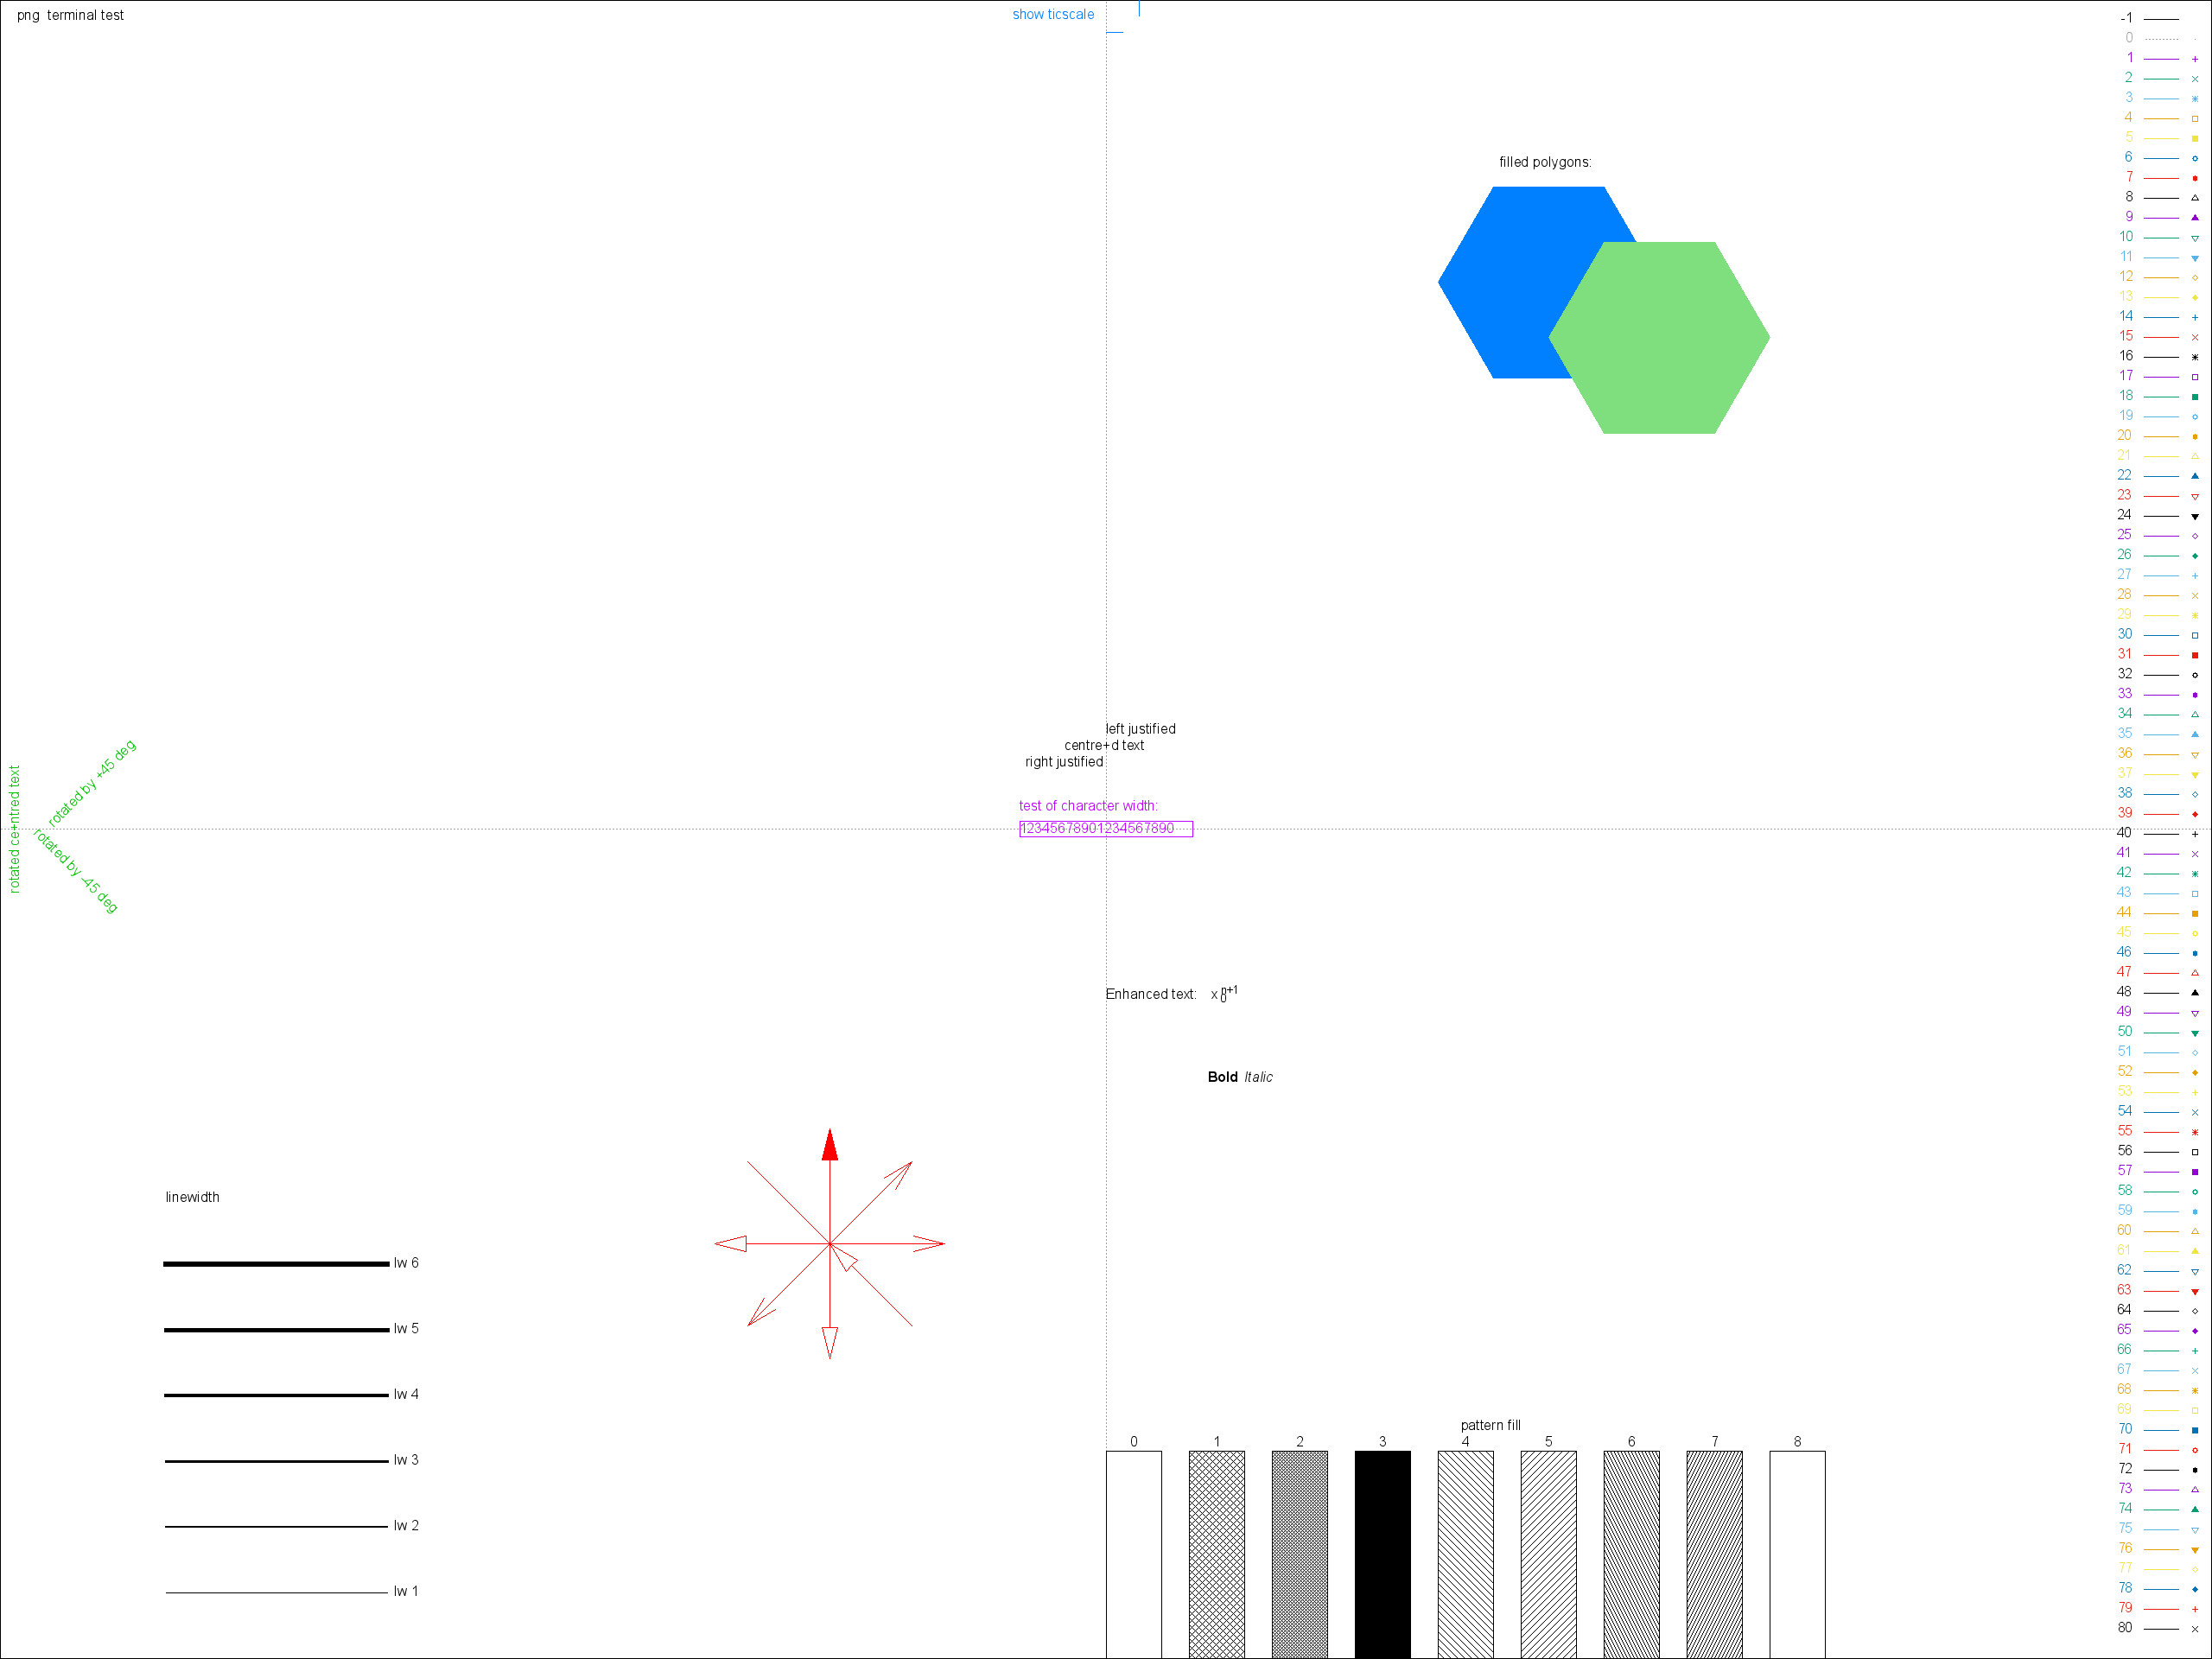
因此,将上述行更改为
set style line 81 lc rgb 'red' lt 3
set style line 82 lc rgb 'blue' lt 2 lw 2
set style line 83 lc rgb 'green' lt 1
set style line 84 lc rgb 'black' lt 0并修改脚本中的plot命令以引用这些行样式编号,您将得到以下情节:
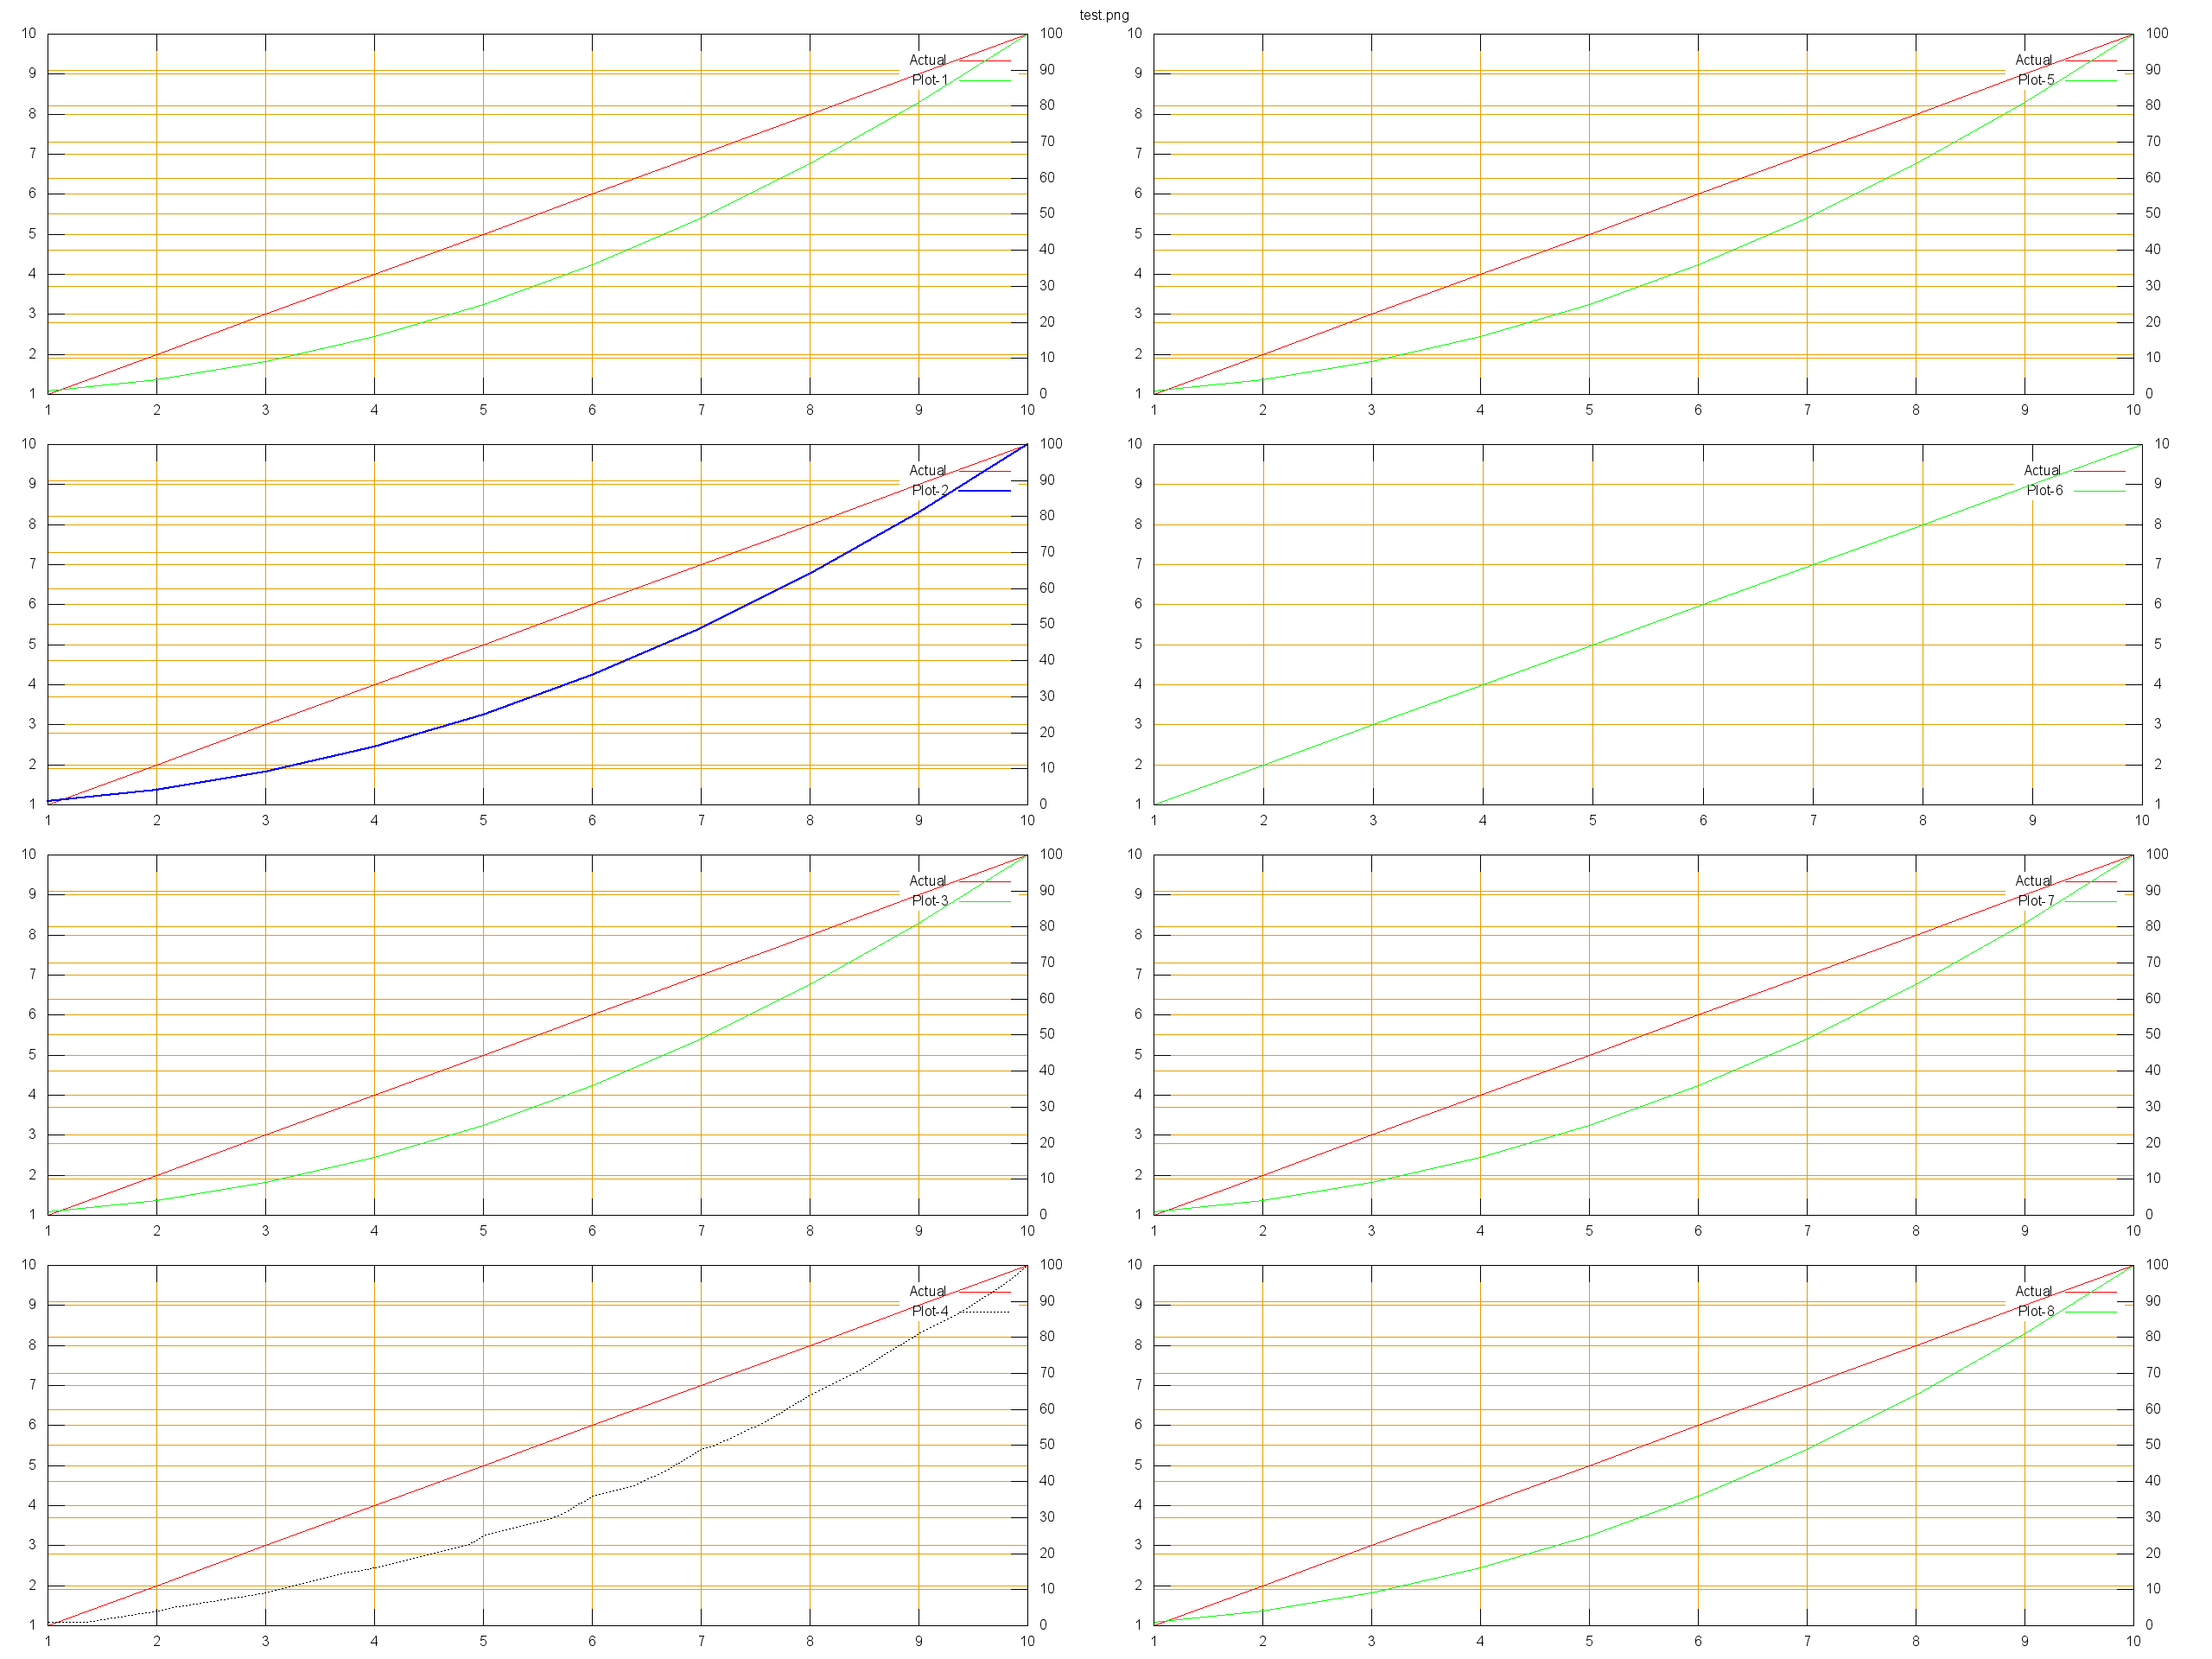
调试备注:
- 真正看起来搞糟情节的是
lw 2选项。奇怪的是,如果您使用lw 3指定了网格线,它们将不会受到影响(但也会比您希望的更厚)。 - 各种组合中的
dashtype选项也不会解决您的问题。对于网格线,它完全被忽略了。 - 除了一种预定义的行类型之外,任何东西都会导致此问题。您可以选择
lt 8,并获得坚实的黑色网格线。 - 您可以考虑使用不同的终端:
set terminal pngcairo对于不同的终端,您的原始脚本的行为与预期相同。
页面原文内容由Stack Overflow提供。腾讯云小微IT领域专用引擎提供翻译支持
原文链接:
https://stackoverflow.com/questions/34689654
复制相关文章
相似问题
腾讯云开发者
