
matplotlib:使用fill_between制作彩色三角形
matplotlib:使用fill_between制作彩色三角形
提问于 2016-01-21 18:45:33
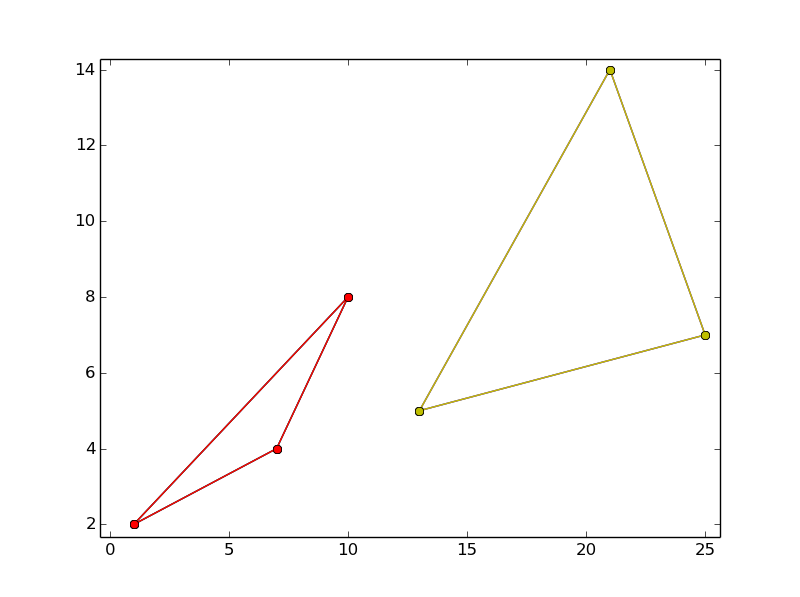
我在空间绘制了随机三角形,下面有代码,但我想用颜色填充三角形。我知道matplotlib中的fill_between()函数,但是我不知道如何在下面的示例中实现它
import matplotlib.pyplot as plt

trianglex = [ 1, 10, 7, 1 ] #repeated last coordinates so that the last coordinate joins the first coordinate to form the outline of the triangle
triangley = [ 2, 8, 4, 2 ]

triangle2x = [ 13, 25, 21, 13]
triangle2y = [ 5,  7 , 14, 5 ]


plt.figure('Triangles')
for i in range(3):
    plt.plot( trianglex, triangley, 'o-')

for i in range(3):
    plt.plot( triangle2x, triangle2y, 'o-')

plt.show()
这给
回答 1
Stack Overflow用户
回答已采纳
发布于 2016-01-21 18:52:03
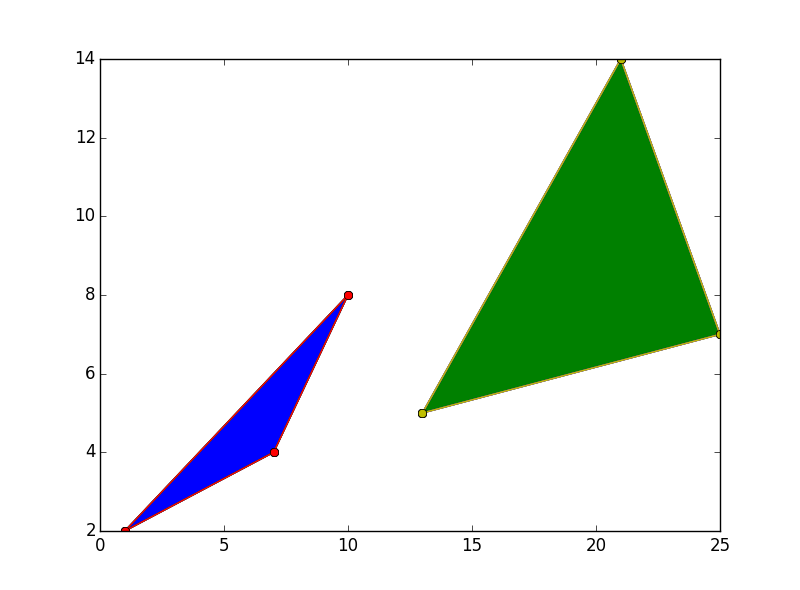
可以使用plt.fill(),如下所示:
import matplotlib.pyplot as plt

trianglex = [ 1, 10, 7, 1 ]
triangley = [ 2, 8, 4, 2 ]
triangle2x = [ 13, 25, 21, 13]
triangle2y = [ 5,  7 , 14, 5 ]

plt.figure('Triangles')
for i in range(3):
    plt.plot(trianglex, triangley, 'o-')
plt.fill(trianglex, triangley)

for i in range(3):
    plt.plot( triangle2x, triangle2y, 'o-')
plt.fill(triangle2x, triangle2y)

plt.show()
输出
页面原文内容由Stack Overflow提供。腾讯云小微IT领域专用引擎提供翻译支持
原文链接:
https://stackoverflow.com/questions/34931864
复制相关文章
相似问题
腾讯云开发者
