
在世界地图上覆盖多个河流图(Sankey图)
在世界地图上覆盖多个河流图(Sankey图)
提问于 2016-01-31 21:57:36
下面这张迷人的图表发表在2016年1月30日的“经济学人”杂志上,为61。它描述了液化天然气(LNG)从五个地区出口到六个地区的情况。R如何绘制类似于它的东西,也许使用几个Sankey图(来自包riverplots),但是箭头反转成所描述的箭头头?也就是说,流入出口地区的资金将显示为流出。
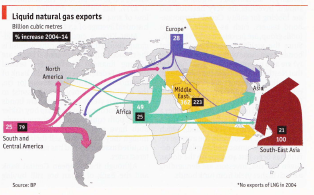
用眼球从地块中提取数据,形成df数据框架。这些变量有奇怪的名称,因为“河川图”需要唯一的节点名。
> dput(df)
structure(list(ID = structure(c(1L, 6L, 9L, 13L, 2L, 7L, 14L,
3L, 10L, 15L, 4L, 11L, 5L, 8L, 12L, 16L), .Label = c("Africa-Asia",
"Africa-Europe", "Africa-Nam", "Africa-SE", "Africa-SthAm", "Europe-Asia",
"Europe-Europe", "Europe-SthAm", "MidEast-Asia", "MidEast-NthAm",
"MidEast-SE", "MidEast-SthAm", "SE Asia-Asia", "Sth Am.-Eur",
"Sth Am.-NthAm", "Sth Am.-SthAm"), class = "factor"), x = c(-30,
1, 20, 100, -30, 1, -100, -30, 20, -100, -30, 20, -30, 1, 20,
-100), y = c(120, 120, 120, 120, 1, 1, 1, -120, -120, -120, 100,
100, -100, -100, -100, -100), value = c(21, 22, 290, 100, 22,
3, 16, 1, 5, 6, 2, 62, 3, 3, 5, 3), col = structure(c(2L, 3L,
5L, 1L, 2L, 3L, 4L, 2L, 5L, 4L, 2L, 5L, 2L, 3L, 5L, 4L), .Label = c("brickred",
"green", "purple", "red", "yellow"), class = "factor"), region = structure(1:16, .Label = c("Asia-Africa",
"Asia-Eur", "Asia-ME", "Asia-SE", "Europe-Africa", "Europe-Eur",
"Europe-SthAm", "No. Am.-Africa", "No. Am.-ME", "No. Am.-Stham",
"SE Asia-Afr", "SE Asia-MI", "Sth. Am.-Africa", "Sth. Am.-Eur",
"Sth. Am.-ME", "Sth. Am.-SthAm"), class = "factor")), .Names = c("ID",
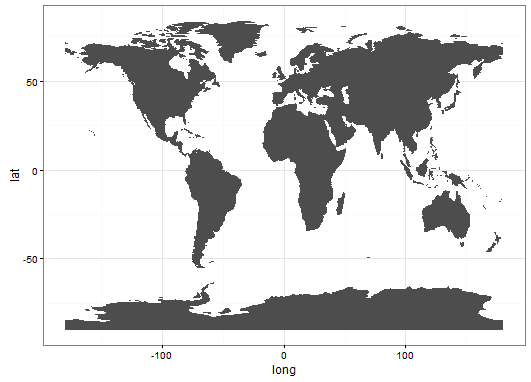
"x", "y", "value", "col", "region"), row.names = c(NA, -16L), class = "data.frame")创建地图很简单(尽管随着南极洲的融化,它看起来会更好!)Tru,目标不是合唱--根据一些可变的颜色区域--但是Ari Lamstein的包choroplethr和它的补充,choroplethrMaps,很容易创建一个世界地图。
library(choroplethr)
library(choroplethrMaps)   # to obtain a map of the world
library(ggplot2)
library(riverplot)

data(country.map)          # choose a world map
world <- ggplot(country.map, aes(long, lat, group=group)) +
  geom_polygon(fill = "grey10") +
  theme_bw()
但是这条河让我失望了,即使我已经完成了一个总体规划,是否有代码可以使其中的四个(每个LNG输出区域一个)并覆盖在世界地图上。
nodes.df <- df
nodes.df$ID <- capwords(as.character(nodes.df$ID))
nodes.df$ID <- as.factor(nodes.df$ID)

edges.df <- df
edges.df <- setNames(edges.df, c("ID", "N1", "N2", "Value", "Color", "Region"))

edges.df <- df[  , c("region", "x", "y", "value", "col", "region")]         #  use different ID names
edges.df <- setNames(edges.df, c("ID", "N1", "N2", "Value", "Color", "Region"))


river <- makeRiver(nodes = nodes.df, edges = edges.df, node_labels = NULL,
                   node_xpos = nodes.df$x, node_ypos = nodes.df$y)

Error in checkedges(edges, nodes$ID) :
edges must not have the same IDs as nodes回答 1
Stack Overflow用户
回答已采纳
发布于 2017-01-06 02:16:42
您可以分别创建Sankey图表,将它们保存为PNG,重新导入它们,并使用grid.raster将它们粘贴到地图上。它和使用Illustrator一样费时费力,但至少它是可编程的(例如准备进行数据更新)。我们以前在我的工作中做过这样的工作,当时我们需要将Sankey图表和其他图形结合起来。
页面原文内容由Stack Overflow提供。腾讯云小微IT领域专用引擎提供翻译支持
原文链接:
https://stackoverflow.com/questions/35120018
复制相关文章
相似问题
腾讯云开发者
