
Python:如何生成一个具有预定义节点位置的无标度网络?
Python:如何生成一个具有预定义节点位置的无标度网络?
提问于 2016-02-18 11:05:41
我想要生成一个无标度网络,遵循Barabasi-Albert算法,包括增长和优先依附。
我使用以下脚本创建网络:
import networkx as nx
import matplotlib.pyplot as plt

n=100 #Number of nodes
m=4 #Number of initial links
seed=100
G=nx.barabasi_albert_graph(n, m, seed)
nx.draw(G)
plt.show()
这将产生以下输出:
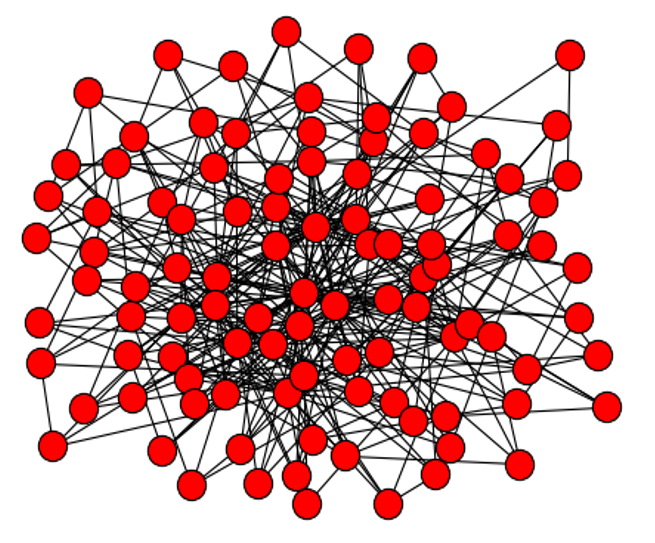
我对节点的定位方式感到不满意。希望它们按照一个预定义的、类似于常规网格的方案进行定位,同时仍然保持无标度的功能:

我可以创建一个反映我的网格的职位字典:
pos = dict( (n, n) for n in G.nodes() )
labels = dict( ((i, j), i + (n-1-j) * n ) for i, j in G.nodes() )
inds=labels.keys()
vals=labels.values()
inds.sort()
vals.sort()
pos2=dict(zip(vals,inds))我的问题:如何修改脚本以获得在pos2中指定的节点位置的Barabasi-Albert图,也就是说,根据我的网格?
回答 2
Stack Overflow用户
回答已采纳
发布于 2016-02-18 11:46:38
import networkx as nx
import matplotlib.pyplot as plt

n = 100  # Number of nodes
m = 4  # Number of initial links
seed = 100
G = nx.barabasi_albert_graph(n, m, seed)

ncols = 10
pos = {i : (i % ncols, (n-i-1) // ncols) for i in G.nodes()}
nx.draw(G, pos, with_labels=True)
plt.show()
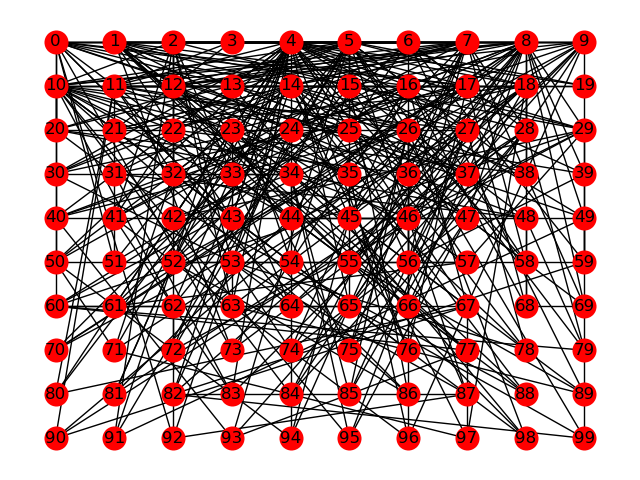
转换模块和整数除法运算符将转置行和列:
pos = {i : (i // ncols, (n-i-1) % ncols) for i in G.nodes()}收益率
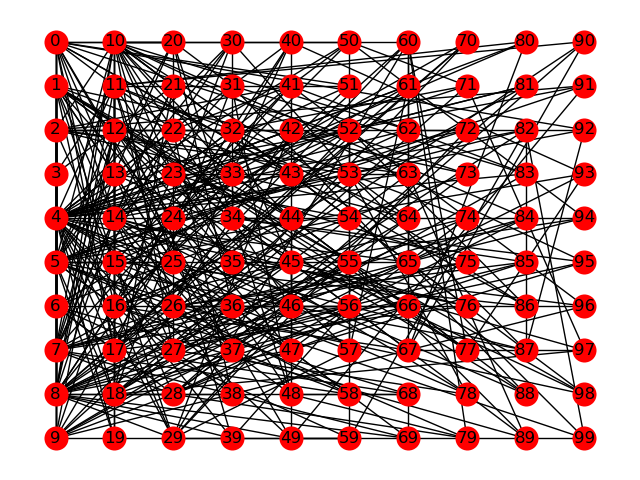
将y-值从(n-i-1) % ncols更改为ncols - (n-i-1) % ncols会翻转关于水平轴的图像:
pos = {i : (i // ncols, ncols - (n-i-1) % ncols) for i in G.nodes()}Stack Overflow用户
发布于 2016-02-18 11:18:15
您计划在图上放置多少个节点?一旦你开始获得超过100 -除非你有惊人数量的视觉房地产,它往往变得完全没有意义,添加任何更多的节点。
我过去曾使用过几种工具,但从未发现其中一种是最好的。
* pygraph
* A Microsoft Graphing engine
* GraphDb - lots of query node power there
* IBM Products - for spacial visualisation
大多数绘图包都将节点位置留给包--我没有使用(也不想使用),这使这成为数据科学家/软件工程师的一项任务
想看看你相处得怎么样..。
页面原文内容由Stack Overflow提供。腾讯云小微IT领域专用引擎提供翻译支持
原文链接:
https://stackoverflow.com/questions/35479686
复制相关文章
相似问题
腾讯云开发者
