
Matplotlib - axvspan对子图
Matplotlib - axvspan对子图
提问于 2016-03-21 16:16:41
我正在为一个沿海工程应用程序编写一个节奏曲脚本,它应该输出一个有两个子图的图形。
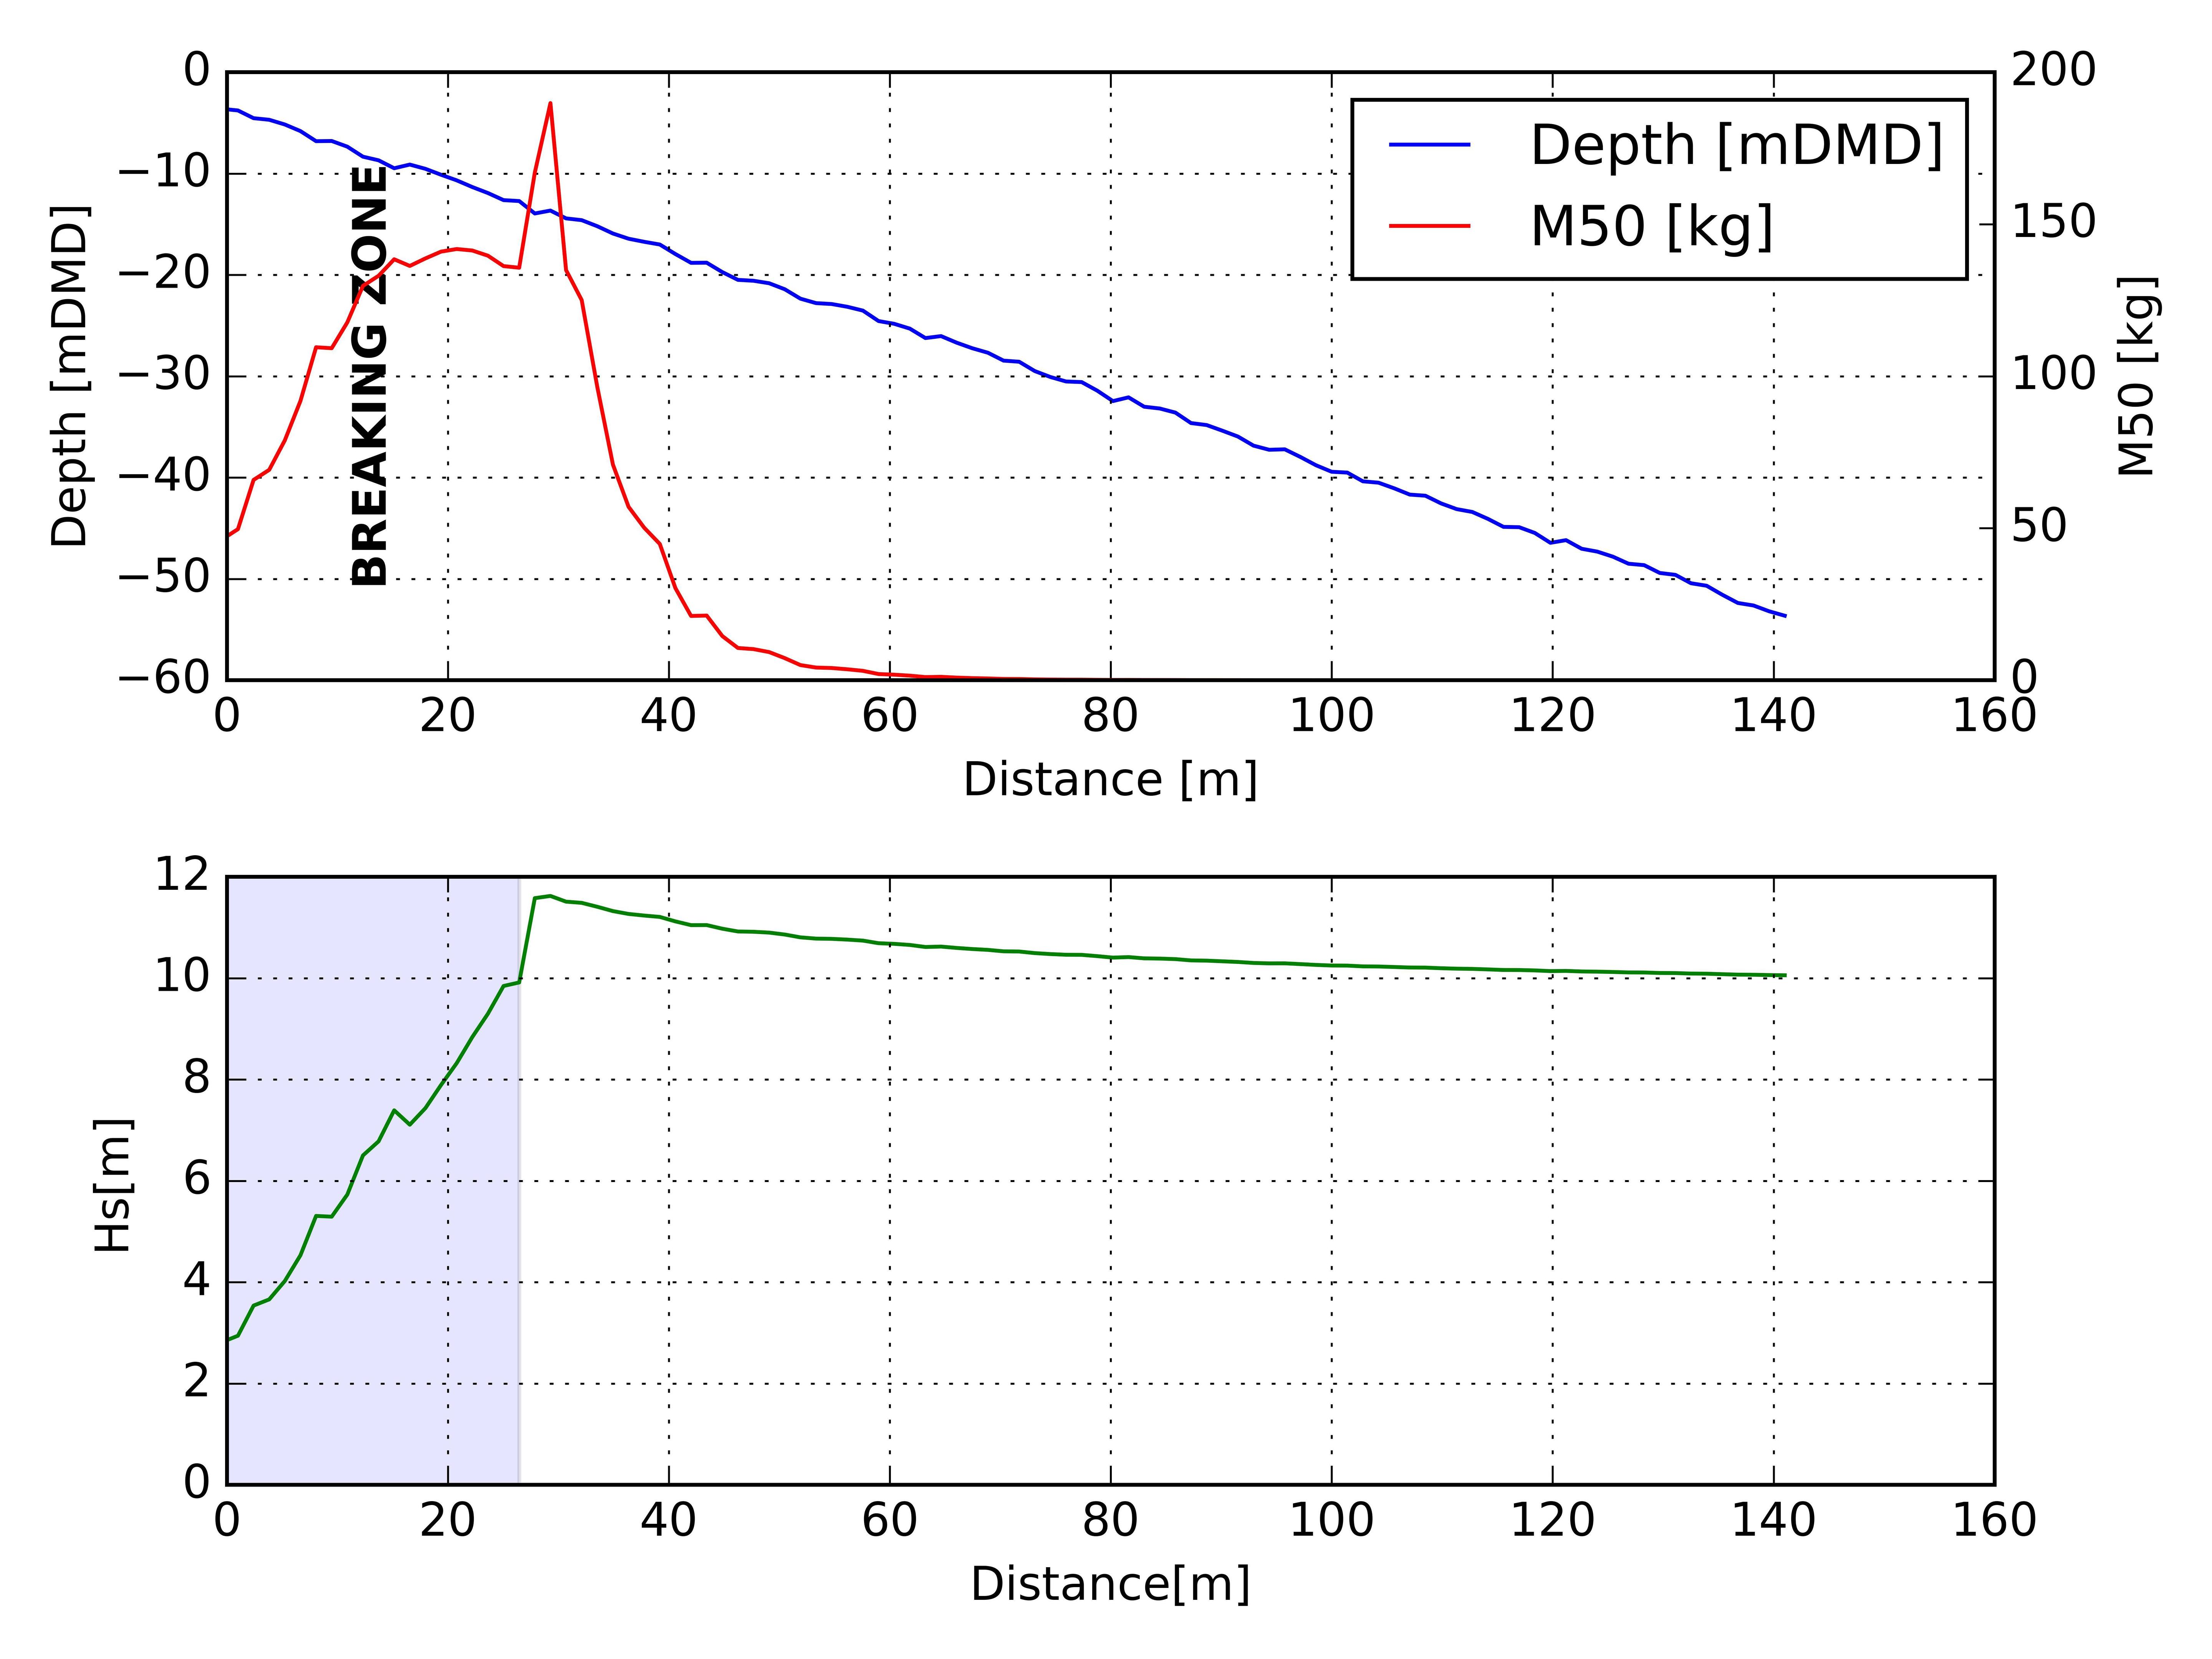
问题是,我想用()对的一个部分进行阴影,这两个子图都使用plt.axvspan(),但出于某种原因,它只遮住了其中的一个。
请在下面找到一段代码的摘录,我在其中设置了情节,以及它目前正在输出的图形(后面的链接)。
谢谢你的帮助,很抱歉这是个新手问题(但碰巧我是Python的新手.但我在其他地方找不到答案。
请随意向代码中添加任何注释。
# PLOTTING
# now we generate a figure with the bathymetry vs required m50 and another figure with bathy vs Hs

#1. Generate plots

fig = plt.figure() # Generate Figure
ax = fig.add_subplot(211) # add the first plot to the figure.
depth = ax.plot(results[:,0],results[:,1]*-1,label="Depth [mDMD]") #plot the first set of data onto the first set of axis.
ax2 = ax.twinx() # generate a secondary vertical axis with the same horizontal axis as the first
m50 = ax2.plot(results[:,0],results[:,6],"r",label="M50 [kg]") # plot the second set of data onto the second vertical axis
ax3 = fig.add_subplot(212) # generate the second subplot
hs = ax3.plot(results[:,0],results[:,2],"g",label="Hs(m)")

#Now we want to find where breaking starts to occur so we shade it on the plot.
xBreakingDistance = results[numpy.argmax(breakingIndex),0]

# and now we plot a box from the origin to the depth of breaking.

plt.axvspan(0,xBreakingDistance,facecolor="b",alpha=0.1) # this box is called a span in matplotlib (also works for axhspan)

# and then we write BREAKING ZONE in the box we just created

yLimits = ax.get_ylim() # first we get the range of y being plotted
yMiddle = (float(yLimits[1])-float(yLimits[0])) / 2 + yLimits[0] # then we calculate the middle value in y (to center the text)
xMiddle = xBreakingDistance / 2 # and then the middle value in x (to center the text)
#now we write BREAKING ZONE in the center of the box.
ax.text(xMiddle,yMiddle,"BREAKING ZONE",fontweight="bold",rotation=90,verticalalignment="center",horizontalalignment="center")

#FIGURE FORMATTING
ax.set_xlabel("Distance [m]") # define x label
ax.set_ylabel("Depth [mDMD]") # define y label on the first vertical axis (ax)
ax2.set_ylabel("M50 [kg]") # define y label on the second vertical axis (ax2)
ax.grid() # show grid
ax3.set_xlabel("Distance[m]") #define x label
ax3.set_ylabel("Hs[m]") # define y label
ax3.grid()
plt.tight_layout() # minimize subplot labels overlapping

# generating a label on a plot with 2 vertical axis is not very intuitive. Normally we would just write ax.label(loc=0)
combined_plots = depth+m50 #first we need to combine the plots in a vector
combined_labels = [i.get_label() for i in combined_plots] # and then we combine the labels
ax.legend(combined_plots,combined_labels,loc=0) # and finally we plot the combined_labels of the combined_plots
plt.savefig("Required M50(kg) along the trench.png",dpi=1000)
plt.close(fig)
输出图:
回答 2
Stack Overflow用户
回答已采纳
发布于 2016-03-21 16:34:38
只需调用plt.axvspan,就可以告诉matplotlib在当前活动的轴上创建axvspan (在本例中,您创建的最后一个轴是ax3)
您需要在您希望它出现的两个轴上绘制axvspan。在这种情况下,ax和ax3。
所以,你可以:
ax.axvspan(0,xBreakingDistance,facecolor="b",alpha=0.1)
ax3.axvspan(0,xBreakingDistance,facecolor="b",alpha=0.1)
或者是一行:
[this_ax.axvspan(0,xBreakingDistance,facecolor="b",alpha=0.1) for this_ax in [ax,ax3]]Stack Overflow用户
发布于 2016-03-21 16:24:44
很难分析您的代码而无法再现它。我建议你建立一个最小的例子。无论如何,请注意,您正在调用"plt.axvspan(“),这是对库的一般调用。
您需要在"ax“和"ax2”中明确说明这一点(我认为)。
另外,如果您需要更多的控制,可以考虑使用补丁(我不知道axvspan):
import matplotlib.pyplot as plt
import matplotlib.patches as patches

fig1 = plt.figure()
ax1 = fig1.add_subplot(111, aspect='equal')
ax1.add_patch(
    patches.Rectangle(
        (0.1, 0.1),   # (x,y)
        0.5,          # width
        0.5,          # height
    )
)
fig1.savefig('rect1.png', dpi=90, bbox_inches='tight')
看到这个例子中对"ax1“的调用了吗?做一些和你类似的东西。或者把轴跨加到你的每一个情节中。
页面原文内容由Stack Overflow提供。腾讯云小微IT领域专用引擎提供翻译支持
原文链接:
https://stackoverflow.com/questions/36136314
复制相关文章
相似问题
腾讯云开发者
