
R中包含阶乘的2个变量函数的绘制
R中包含阶乘的2个变量函数的绘制
提问于 2016-05-11 16:20:57
我无法找到解决这个问题的可行办法(而且我是R方面的初学者)。
我有一个方程式如下所示

其中n和K是常数。A和b是变量。
如何在R中生成上述二维图?
提前谢谢。
回答 1
Stack Overflow用户
发布于 2016-05-11 17:11:09
factorialfunction <-function(a,b, n, K){
K*(b^a)*((2+b)^(n+a))
}
Klist = c(1,5,10,50,100,200)
nlist = c(1,5,10,50,100,200)
#note that the n and K values are recycled, make them whatever you wish, they are constants,
#while a and b take on any values, here 100 values between zero and one
res <- mapply(factorialfunction,a = seq(.01,1,by=.01),
b=seq(.01,1,by=.01), n = rep(nlist,each = 100), K=rep(Klist, each=100))
#Then you can plot this six times.
#allow six plots on the panel if you want
par(mfrow = c(3,2))
#loop through different plots
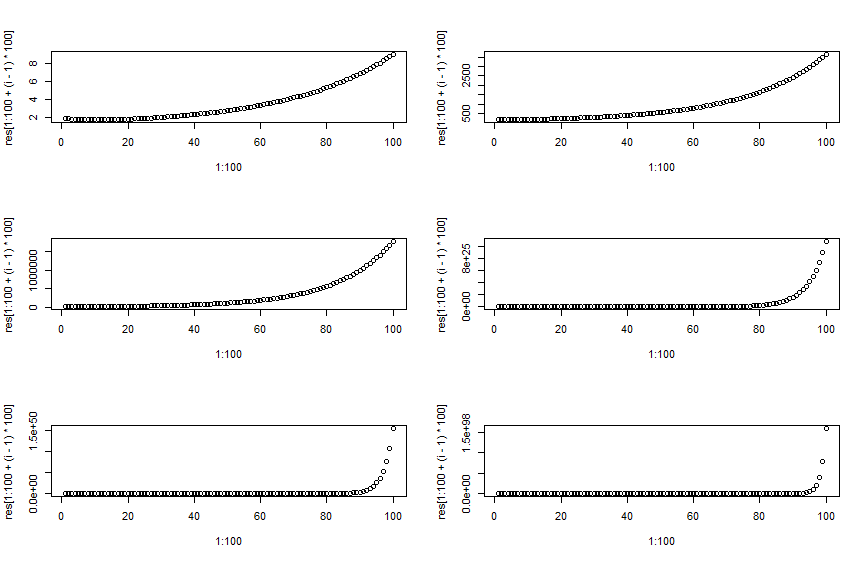
for (i in 1:6)
plot(1:100,res[1:100 + (i-1)*100])注意,在这段代码中,我选择了a和b介于0到1之间,我不太熟悉这个函数,但它看起来像某种类型的Beta。
通过更改klist和nlist以及par和for循环参数,您可以生成6幅以上的图。
下面是您得到的,注意,这段代码是可定制的,可以为n、K、a和b的值生成所需的绘图。
页面原文内容由Stack Overflow提供。腾讯云小微IT领域专用引擎提供翻译支持
原文链接:
https://stackoverflow.com/questions/37168241
复制相关文章
相似问题
腾讯云开发者
