
改变Python脚本中的标记样式/颜色
改变Python脚本中的标记样式/颜色
提问于 2016-05-26 14:05:11
我使用Python2.7并使用scipy.stats.probplot函数创建了一个概率图。我想改变图形的元素,如颜色/形状/标记的大小和最适合的趋势线的颜色/宽度。概率图的文档似乎没有任何选项可以更改这些项。
以下是我的代码(相关部分):
#data is a list of y-values sampled from a lognormal distribution
d = getattr(stats, 'lognorm')
param = d.fit(data)
fig = plt.figure(figsize=[6, 6], dpi=100)
ax = fig.add_subplot(111)
fig = stats.probplot(data, dist='lognorm', sparams=param, plot=plt, fit=False)
#These next 3 lines just demonstrate that some plot features
#can be changed independent of the probplot function.
ax.set_title("")
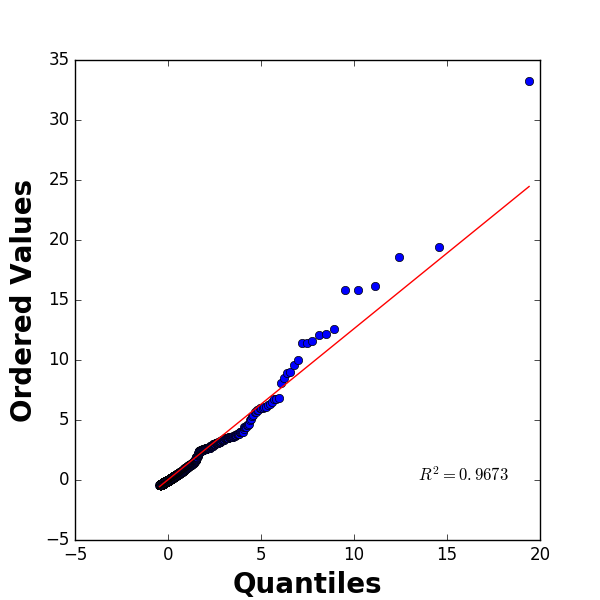
ax.set_xlabel("Quantiles", fontsize=20, fontweight='bold')
ax.set_ylabel("Ordered Values", fontsize=20, fontweight='bold')
plt.show()我试着抓取xy数据,并使用ax.get_xydata()和fig.get_xydata()创建自己的散点图。但是,这两种方法都失败了,因为两个对象都没有将get_xydata()作为函数。我的代码当前生成的数字是:
回答 1
Stack Overflow用户
回答已采纳
发布于 2016-05-26 14:34:38
关键是与matplotlib的组合。
您可以使用线对象从轴对象访问ax.get_lines()。然后,可以相应地更改属性。
您可能需要弄清楚哪个索引与标记相关,哪个索引与行相关。在下面的示例中,标记首先出现,因此:
ax.get_lines()[0].set_marker('p')而趋势线是第二条:
ax.get_lines()[1].set_linewidth(12.0)下面的示例基于概率图文件
import numpy as np
from scipy import stats
import matplotlib.pyplot as plt

nsample = 100
np.random.seed(7654321)

fig = plt.figure()
ax = fig.add_subplot(111)
x = stats.t.rvs(3, size=nsample)
res = stats.probplot(x, plot=plt)

ax.get_lines()[0].set_marker('p')
ax.get_lines()[0].set_markerfacecolor('r')
ax.get_lines()[0].set_markersize(12.0)

ax.get_lines()[1].set_linewidth(12.0)

plt.show()
这样创建的情节看起来很难看,但演示了以下功能:
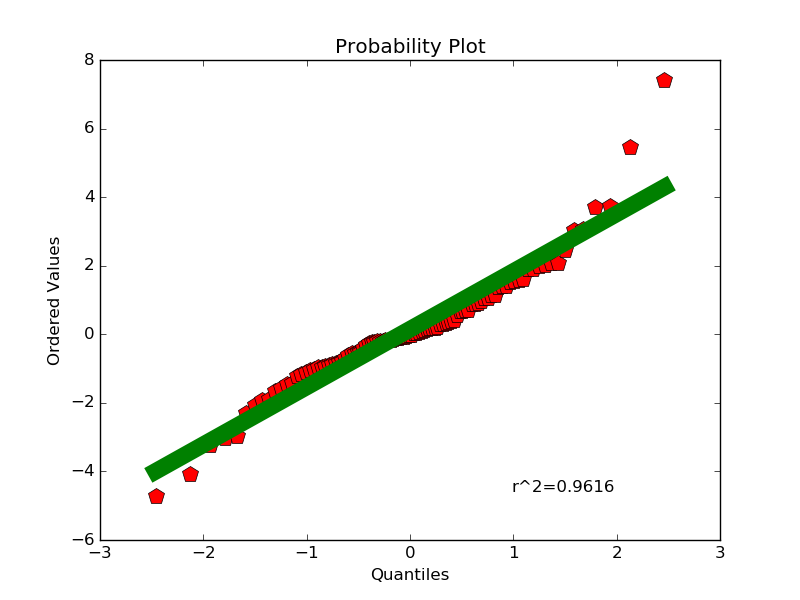
文本(r^2=0.9616)可以通过更一般的get_children从轴访问:
ax.get_children()[2].set_fontsize(22.0)在不了解这些项的索引的情况下,您可以尝试使用:
print ax.get_children()这给了你:
[<matplotlib.lines.Line2D object at 0x33f4350>, <matplotlib.lines.Line2D object at 0x33f4410>,
<matplotlib.text.Text object at 0x33f4bd0>, <matplotlib.spines.Spine object at 0x2f2ead0>,
<matplotlib.spines.Spine object at 0x2f2e8d0>, <matplotlib.spines.Spine object at 0x2f2e9d0>,
<matplotlib.spines.Spine object at 0x2f2e7d0>, <matplotlib.axis.XAxis object at 0x2f2eb90>,
<matplotlib.axis.YAxis object at 0x2f37690>, <matplotlib.text.Text object at 0x2f45290>,
<matplotlib.text.Text object at 0x2f45310>, <matplotlib.text.Text object at 0x2f45390>,
<matplotlib.patches.Rectangle object at 0x2f453d0>]页面原文内容由Stack Overflow提供。腾讯云小微IT领域专用引擎提供翻译支持
原文链接:
https://stackoverflow.com/questions/37463189
复制相关文章
相似问题
腾讯云开发者
