
R谱或字迹脚本
R谱或字迹脚本
提问于 2016-05-28 14:19:07
我试图在R中构建一个行为图或行为图。我已经测量了一个超过150秒的行为(以1秒的分辨率),其中我在excel中写下了以下内容:空单元格表示“无行为”,包含1表示“行为”的单元格。每只动物代表一行(150个细胞长),在每个实验中得分的动物数量是不同的(n在11到20之间)。到目前为止,我已经将所有原始数据导出为*.csv。
下面是前四行的示例,其中包含一个*.csv文件中的每个~40个数据点(每行为1个动物,每个数据点为逗号分隔):
,,,,,,,,,,,,,,,,,,,,,,,,,,,,,,1,1,1,1,1,1,1,1,1,1

,,,,,,,,,,,,,,,,,,,,,,,,,,,,,,1,1,1,1,1,1,1,1,1,

,,,,,,,,,,,,,,,,,,,,,,,,,,,,,,1,1,,,,,,1,1,1,,,,

,,,,,,,,,,,,,,,,,,,,,,,,,,,,,,1,1,,1,1,1,1,1,,,,我想在R中创建一个类似于图7C中的图:https://elife-publishing-cdn.s3.amazonaws.com/08758/elife-08758-fig7-v2.jpg (整个免费文章在这里:https://elifesciences.org/content/4/e08758)。随着时间的推移,这种行为将被描绘成“小盒子”(在插图中颜色可能会稍后改变)。从一个*csv文件(实验)中创建每一个图将是很好的。
有谁能帮帮我呢?
Stack Overflow用户
回答已采纳
发布于 2016-05-28 15:39:41
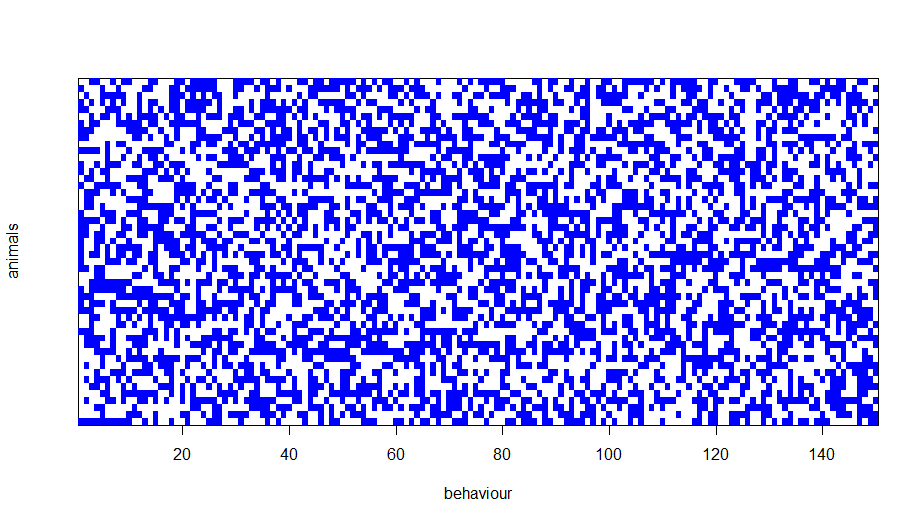
下面是使用image()函数的一个可能的解决方案:
# custom function using image to emulate an ethograph
ethograph <- function(zeroOneMatrix, color='blue',xlab='behaviour',ylab='animals'){
  m <- as.matrix(zeroOneMatrix)
  m[m == 0] <- NA
  nAnimals <- nrow(m)
  nTimeSlots <- ncol(m)

  image(x=1:nTimeSlots,
        y=1:nAnimals,
        z=t(m[nAnimals:1,]),
        col=c(color),
        xlab=xlab,
        ylab=ylab,
        yaxt = 'n')
}

# here we create a random matrix of 0 and 1 (animals on the rows and time slots on columns)
# of course you will get your data reading the csv
set.seed(123)
nTimeSlots <- 150
nAnimals <- 50
csv1 <- matrix(sample(0:1,nTimeSlots*nAnimals,replace=TRUE),nrow=nAnimals)

# let's plot
ethograph(csv1, color='blue')
结果:
页面原文内容由Stack Overflow提供。腾讯云小微IT领域专用引擎提供翻译支持
原文链接:
https://stackoverflow.com/questions/37500080
复制相关文章
相似问题
腾讯云开发者
