
R shinyapp -如何从csv打开和绘图。获取错误:尝试在get1index中选择少于一个元素
R shinyapp -如何从csv打开和绘图。获取错误:尝试在get1index中选择少于一个元素
提问于 2016-06-01 07:45:12
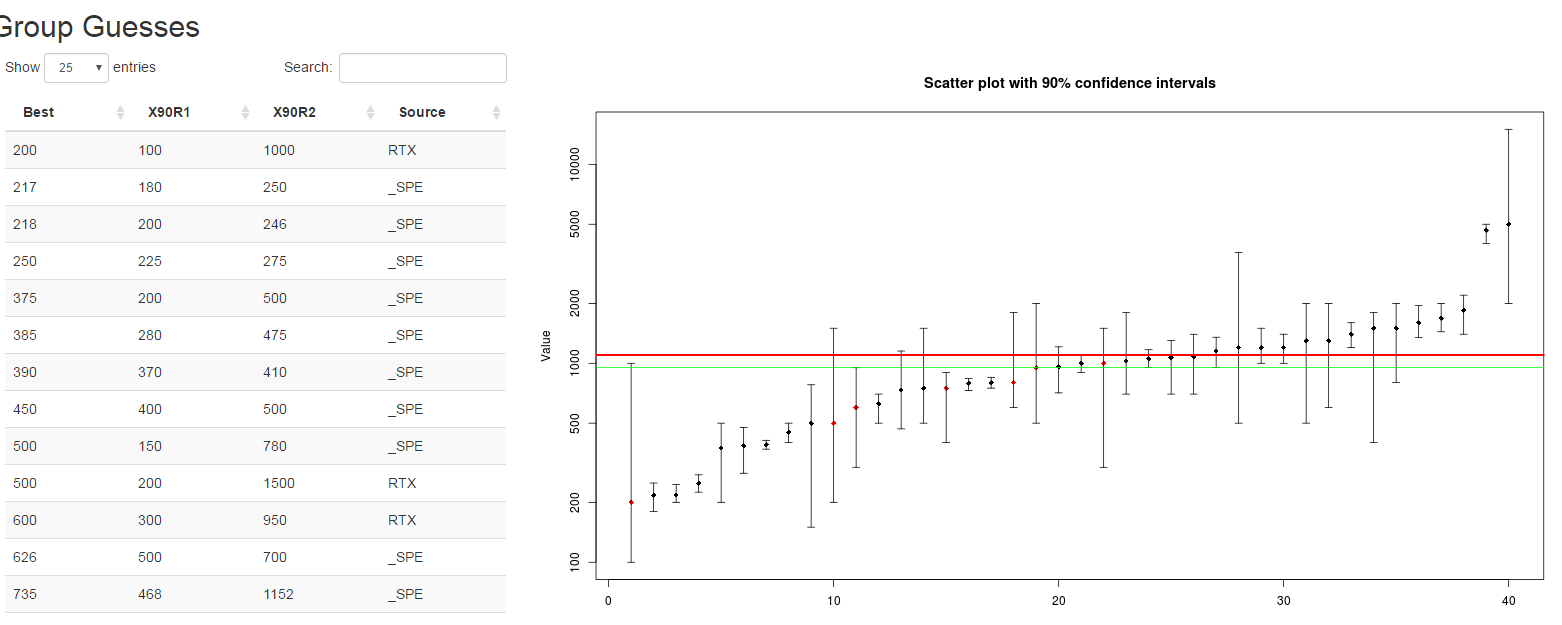
我刚开始使用shinyapp,并尝试构建一个简单的应用程序,它可以打开一个包含四列的.csv。打开后,用户可以选择三列用于绘制a)点和b)范围以上和下方的各个点-见下面的第一张图片。但是,此时我不知道如何在图中引用我的点数据。我得到了Error: attempt to select less than one element in get1index. -见下面的第二张图片。nI在文本底部包含了一个5行.csv文件。期望产出:
新错误无,已解决。
更新:下面的代码现在起作用了-参见注释
   # Set wd
#setwd("C:/Data/SCRIPTS/R/Uncertainty/MCSims/simsShinyApp")

# Set libraries
library(shiny)
library(rriskDistributions)
library(ggplot2)
library(dplyr)

ui <-
        shinyUI(fluidPage(tabsetPanel(
                tabPanel("Group Data", " ",
                         fluidRow(
                                 titlePanel(h2("Group Guesses"), br()),

                                 column(width = 2,
                                        " ",
                                         fileInput('datafile', 'Choose CSV file',
                                                   accept=c('text/csv', 'text/comma-separated-values,text/plain')),
                                         uiOutput("selectcol1"),
                                         uiOutput("selectcol2"),
                                         uiOutput("selectcol3"),
                                         uiOutput("selectcol4")
                                 ),

                                 column(width = 3,
                                        " ",
                                        dataTableOutput('filedata')),
                                 column(width = 7,
                                        " ",
                                        plotOutput("plot6", height = "600px"))
                         ))
        )))

server <- function(input, output) {
        filedata <- reactive({
                infile <- input$datafile
                if (is.null(infile)) {
                        # User has not uploaded a file yet
                        return(NULL)
                }
                read.csv(infile$datapath)
        })

        # filedata() <- filedata()[order(filedata()[[input$selectcol1]]]


        x <- reactive({
                1:dim(filedata())[1]
        })

        output$selectcol1 <- renderUI({
                df <-filedata()
                if (is.null(df)) return(NULL)

                items=names(df)
                names(items)=items
                selectInput("selectcol1", "Best Estimate",items)

        })

        output$selectcol2 <- renderUI({
                df <-filedata()
                if (is.null(df)) return(NULL)

                items=names(df)
                names(items)=items
                selectInput("selectcol2", "Lower Bound",items)
        })

        output$selectcol3 <- renderUI({
                df <-filedata()
                if (is.null(df)) return(NULL)

                items=colnames(df)
                names(items)=items
                selectInput("selectcol3", "Upper Bound:",items)

        })

        output$selectcol4 <- renderUI({
          df <-filedata()
          if (is.null(df)) return(NULL)

          items=colnames(df)
          names(items)=items
          selectInput("selectcol4", "Source:",items)

        })

        output$filedata = renderDataTable({
                filedata()

        })
        output$plot6 <- renderPlot({
                plot(
                        x(),
                        filedata()[[input$selectcol1]],
                        log = "y",
                        ylim = range(c(min(
                          filedata()[[input$selectcol2]]
                        ), max(
                          filedata()[[input$selectcol3]]
                        ))),
                        pch = 18,
                        xlab = "Guess",
                        ylab = "Value",
                        main = "Scatter plot with 90% confidence intervals",
                        col = filedata()[[input$selectcol4]]
                )
                # hack: we draw arrows but with very special "arrowheads"
                arrows(
                        x(),
                        filedata()[[input$selectcol2]],
                        x(),
                        filedata()[[input$selectcol3]],
                        length = 0.05,
                        angle = 90,
                        code = 3
                )
                abline(h = 951, col = "green")
                abline(h = ave(filedata()[[input$selectcol1]]), col = "red")
        })
}

shinyApp(ui = ui, server = server)
file.csv
Best,Lb,Up,Source
5,3,10,Bill
6,2,8,Tom
6,3,11,Bill
4,1,12,Tom回答 1
Stack Overflow用户
回答已采纳
发布于 2016-06-02 06:10:25
把我所有的战友都集合起来回答
1)您需要了解input和output之间的差异,这里需要在图中使用input$ids来获取选定的数据。
2)对于每个元素uiOutput("col1")和selectInput("col1",..)都有相同的id,最好设置不同的id。
3) input$selectcol1返回character向量,因此,如果要获得具有名称== input$selectcol1的列,则需要filedata()[[input$selectcol1]]
页面原文内容由Stack Overflow提供。腾讯云小微IT领域专用引擎提供翻译支持
原文链接:
https://stackoverflow.com/questions/37562445
复制相关文章
相似问题
腾讯云开发者
