
从闪亮的图形中删除ggvis情节
从闪亮的图形中删除ggvis情节
提问于 2016-06-10 19:03:01
我有多个闪亮的ggvis图。我需要提供一个动作按钮,如果按钮被点击,所有的情节都需要删除。
下面是ui.R和server.R的示例代码
ui.R
library(ggvis)
library(shiny)

shinyUI(fluidPage(
  titlePanel("Plotting slopes"),

  sidebarLayout(
  sidebarPanel(
  selectInput("segment", label = "Choose segment", choices = c("K 1", "K 2")),
  actionButton("abutton","Delete plots")),

mainPanel(ggvisOutput("plot"), ggvisOutput("plot2"))
)
))
server.R
library(shiny)
library(ggvis)
mtcars$cyl = factor(mtcars$cyl)
df1 = subset(mtcars, am == 0)
df2 = subset(mtcars, am == 1)
shinyServer(function(input, output) {
dataInput = reactive({
switch(input$segment,
"K 1" = df1,
"K 2" = df2)
})
values = function(x){
if(is.null(x)) return(NULL)
dat = dataInput()
row = dat[dat$cyl %in% unique(x$cyl), ]
paste0("Ave Weight: ", mean(row$wt),"<br />",
"Ave Carb: ", mean(row$carb), "<br />")
}
vis1 = reactive({
dat = dataInput()
dat %>%
group_by(cyl) %>%
ggvis(~mpg, ~wt) %>%
layer_paths(stroke = ~cyl, strokeOpacity := 0.3,
strokeWidth := 5) %>%
add_tooltip(values, "hover")
})
vis1 %>% bind_shiny("plot")
vis2 = reactive({
dat = dataInput()
dat %>%
group_by(cyl) %>%
ggvis(~mpg, ~wt) %>%
layer_paths(stroke = ~cyl, strokeOpacity := 0.3,
strokeWidth := 5) %>%
add_tooltip(values, "hover")
})
vis2 %>% bind_shiny("plot2")
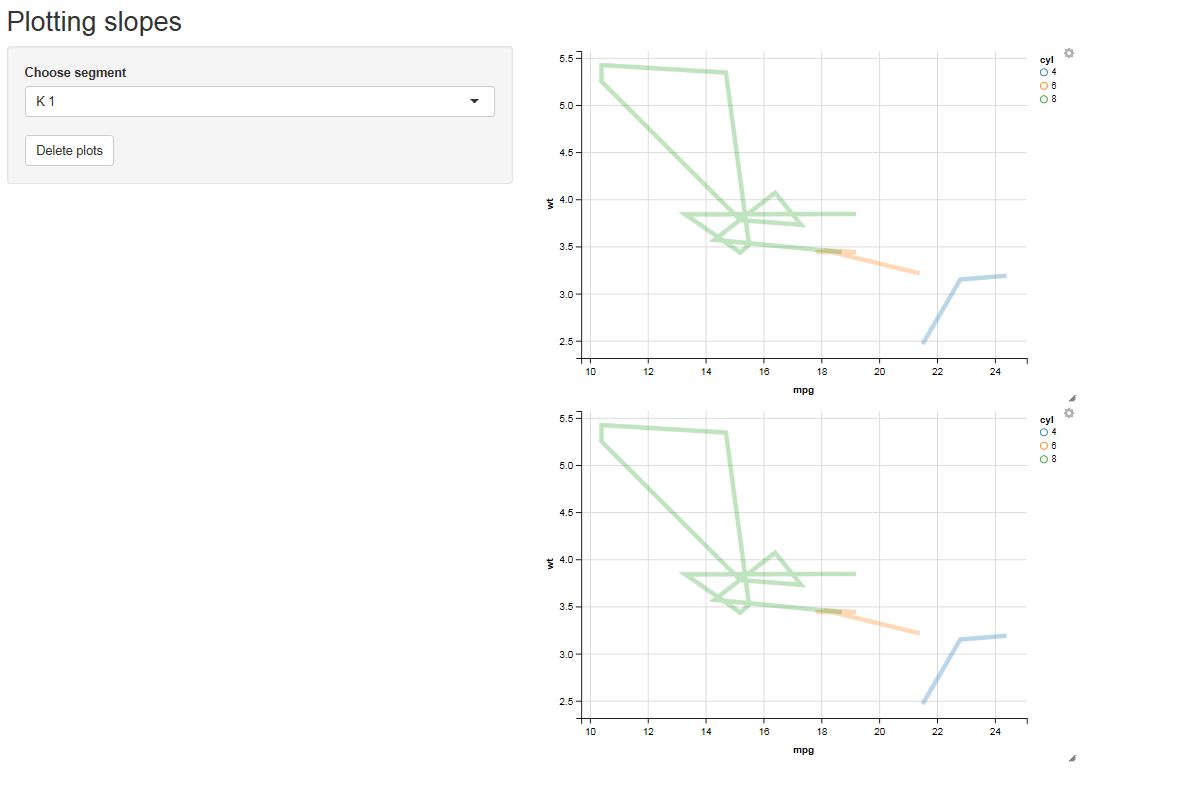
})当前输出的屏幕截图:
回答 1
Stack Overflow用户
回答已采纳
发布于 2016-06-11 07:31:41
如果您容忍没有删除但看起来像已删除的情节,我认为给bind_shiny()一个空白图是很容易的。
server.R
  :
  vis2 %>% bind_shiny("plot2")    # the same up to here

  vis3 = mtcars %>%                   # preparation of a blank graph
    ggvis(~mpg, ~wt, opacity := 0) %>%
    layer_points() %>%
    hide_axis("x") %>%
    hide_axis("y")

  observeEvent(input$abutton, {    # When the button is clicked,
    bind_shiny(vis3, "plot")       # bind_shiny() reads and outputs a blank graph, vis3.
    bind_shiny(vis3, "plot2")      # When other Input is done, vis1 and vis2 return.
  })

})页面原文内容由Stack Overflow提供。腾讯云小微IT领域专用引擎提供翻译支持
原文链接:
https://stackoverflow.com/questions/37755494
复制相关文章
相似问题
腾讯云开发者
