
在Matlab中用空白替换值
在Matlab中用空白替换值
提问于 2016-06-14 15:59:02
我在单元格中找到了一些解决方案,但Numberarrays没有找到解决方案。
问题很简单,我有一个Array a=(0,1,2,3,4,5,6,7),我想用像这个a=(0,'',2,''...)那样的“空白空间”来修改其他的值,这样数组就可以保持相同的长度,但是只有其他的值。
当我尝试像这样的a(2:2:end)='';
我得到a=(0,2,4,6),长度是不一样的。
当我尝试a(2:2:end)=blanks(1);时
),但不完全正确,我得到了a=(0,'32',2,'32',4,'32'...)
我知道,实际上32意味着“空间”(ASCII)然后,我尝试使用它来设置我的TickLabels,但是它将它解释为32,而不是ASCII。
Stack Overflow用户
回答已采纳
发布于 2016-06-14 16:38:59
不能将空格作为数字数组中的条目引入。你只能介绍数字。
如果要将其用作滴答标签,请转换为单元格数组,然后可以将某些单元格的内容设置为[] (空):
a = [0 1 2 3 4 5 6 7]; % original vector
a = num2cell(a); % convert to cell
a(2:2:end) = {[]}; % set some cells' contents to []
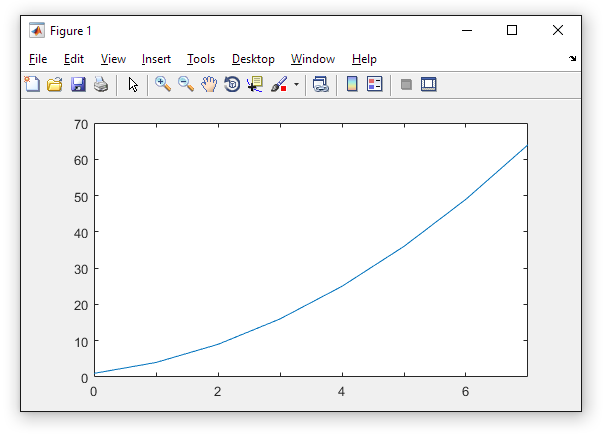
x = 1:8; % x data for example plot
y = x.^2; % y data for example plot
plot(x, y) % x plot the graph
set(gca, 'xticklabels', a) % set x tick labels
要获得不需要科学符号的滴答标签,请使用带有适当格式的num2str:
a = [0 1 2 3 4 5 6 7]*1e6; % original vector
a = num2cell(a); % convert to cell
a(2:2:end) = {[]}; % set some cells' contents to []
a = cellfun(@num2str, a, 'Uniformoutput', false); % convert each number to a string

x = [0 1 2 3 4 5 6 7]*1e6; % x data for example plot
y = x.^2; % y data for example plot
plot(x, y) % x plot the graph
set(gca, 'xticklabels', a) % set x tick labels页面原文内容由Stack Overflow提供。腾讯云小微IT领域专用引擎提供翻译支持
原文链接:
https://stackoverflow.com/questions/37816914
复制相关文章
相似问题
腾讯云开发者
