
如何在matlab图中对2y轴左右进行相同的标度、限制和刻度
如何在matlab图中对2y轴左右进行相同的标度、限制和刻度
提问于 2016-06-16 04:16:30
下面是我在MATLAB图中对两个y轴都有相同比例的代码:
%% Additions by Dev-iL:
date = 1:10;
z = 4*randn(3,10);
spread = 0.2*sum(z,1);
figure();
%% Original code by RSerrano:
ax(2) = subplot(2,1,2);
% z = horzcat(zscore,signal1,signal2); % Dev-iL
  yyaxis left
  plot(date,z,'LineWidth',0.5);
  ylabel('Z-score(residuals)');
  set(ax(2),'YColor',[0 0 0],'YDir','normal');
  ax(2).YLimMode = 'manual';
  ax(2).YLim = [-8 8];
  ax(2).YTickMode = 'manual';
  ax(2).YTick = -8:2:8;

co1 = get(gca,'ColorOrder');
% Change to new colors.
set(gca, 'ColorOrder', [0.83 0.82 0.78; 0 0.5 0; 0.47 0.67 0.19],...
         'NextPlot', 'replacechildren');
co1 = get(gca,'ColorOrder');
plot(date,z,'LineWidth',0.3);

z2 = spread;
yyaxis right
plot(date,z2,'Color',[0.31 0.31 0.31], 'LineWidth',0.5);
xlabel('Date');
ylabel('Spread(USD)');
title(['Spread and Trade Signals']);
legend('Z-score','Signal1', ...
'Signal2','Spread', ...
'Location','NE');
set(ax(2),'YColor',[0 0 0],'YDir','normal');

ax(2).YTick = -8:2:8;
axis tight
grid on
这导致:
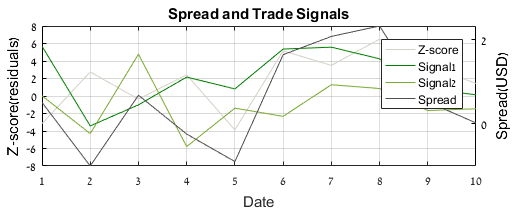
如何使左y轴的ylim和ytick与右y轴相同?或者如何将左y轴的ylim和ytick应用到右y轴?
回答 1
Stack Overflow用户
回答已采纳
发布于 2016-06-16 07:29:06
从您使用的yyaxis判断,我假设您有R2016a,因此使用HG2。
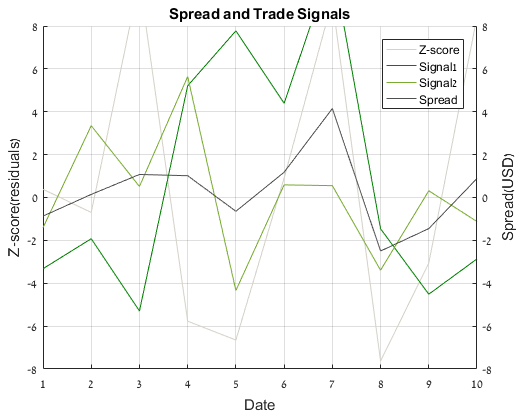
作为yyaxis的另一种选择,假设您只希望两边有相同的滴答,您只需复制轴并将y轴的位置设置为右边(如类似的问题here所示):
hR = axes('ylim', [y(1) y(end)],'XTick', [], 'YTick', y,'YAxisLocation', 'right',...
            'XTickLabel',[]);
使用稍微重新排列的代码版本:
%% Definitions:
date = 1:10;
z = 4*randn(3,10);
z2 = 0.2*sum(z,1);
y = -8:2:8;
%% Create the figure:
figure(); hL = gca;
set(hL, 'ColorOrder', [0.83 0.82 0.78; 0 0.5 0; 0.47 0.67 0.19],...
        'NextPlot', 'replacechildren');
plot(date, z,'LineWidth',0.5); hold on;
plot(date, z2,'Color',[0.31 0.31 0.31], 'LineWidth',0.5);
%% Customize plots:
grid on
xlabel(hL,'Date');
ylabel(hL,'Z-score(residuals)');
hL.YLimMode = 'manual';
hL.YLim = [y(1) y(end)];
hL.YTickMode = 'manual';
hL.YTick = y;

title(['Spread and Trade Signals']);
legend(hL,'Z-score','Signal1', ...
'Signal2','Spread', ...
'Location','NE');

hR = axes('ylim', [y(1) y(end)],'XTick', [], 'YTick', y,'YAxisLocation', 'right',...
            'XTickLabel',[],'Color','none');
ylabel(hR,'Spread(USD)');
linkaxes([hL,hR],'xy'); % To sync zooming, panning etc.
结果如下:
与subplot一起使用
在这里,我们可能需要使用axes来创建新的轴,而不是使用copyobj创建它们(这是因为axes命令碰巧在正确的Position中创建了新的轴,这是轴的默认Position;在subplot中Position不是默认的,所以前面的技巧不起作用):
%% Definitions:
date = 1:10;
z = 4*randn(3,10);
z2 = 0.2*sum(z,1);
y = -8:2:8;
%% Create the figure:
figure(); subplot(2,1,2); hL = gca;
set(hL, 'ColorOrder', [0.83 0.82 0.78; 0 0.5 0; 0.47 0.67 0.19], 'NextPlot', 'replacechildren');
plot(date, z,'LineWidth',0.5); hold on;
plot(date, z2,'Color',[0.31 0.31 0.31], 'LineWidth',0.5);
%% Customize plots:
grid on
xlabel(hL,'Date');
ylabel(hL,'Z-score(residuals)');
hL.YLimMode = 'manual';
hL.YLim = [y(1) y(end)];
hL.YTickMode = 'manual';
hL.YTick = y;

hR = copyobj(hL,gcf);
hR.YAxisLocation = 'right';

title(['Spread and Trade Signals']);
legend(hL,'Z-score','Signal1', ...
'Signal2','Spread', ...
'Location','NE');

ylabel(hR,'Spread(USD)');
linkaxes([hL,hR],'xy'); % To sync zooming, panning etc.页面原文内容由Stack Overflow提供。腾讯云小微IT领域专用引擎提供翻译支持
原文链接:
https://stackoverflow.com/questions/37849806
复制相关文章
相似问题
腾讯云开发者
