
在matplotlib中绘制具有相同属性的多个函数
在matplotlib中绘制具有相同属性的多个函数
提问于 2016-06-22 21:26:19
我试图可视化来自单个参数的多个函数。我需要做一些关于参数的循环。我想为所有给定参数的绘制函数指定相同的颜色、图例等。
问题是,所有我尝试的情节,材料分配不同的颜色,总是给一个标签。
我想要实现这样的目标:
import numpy as np
import matplotlib.pyplot as plt
def plot2():
    fig, ax = plt.subplots()
    x = np.arange(0,10,0.1)
    ax.plot(x,1*np.sin(x),'b-')
    ax.plot(x,1*np.cos(x),'b-',label='trig a={}'.format(1))
    ax.plot(x,2*np.sin(x),'g-')
    ax.plot(x,2*np.cos(x),'g-',label='trig a={}'.format(2))
    ax.plot(x,3*np.sin(x),'r-')
    ax.plot(x,3*np.cos(x),'r-',label='trig a={}'.format(3))
    ax.legend()
但功能如下:
def plotTrig():
    fig, ax = plt.subplots()
    x = np.arange(0,10,0.1)
    for a in [1,2,3]:
        ax.plot(x,a*np.sin(x),x,a*np.cos(x),label='trig a={}'.format(a))
    ax.legend()
以上只是简化的例子。在实践中,我有更多的功能和参数,所以使用循环颜色的解决方案没有多大帮助。
回答 1
Stack Overflow用户
回答已采纳
发布于 2016-06-24 13:52:16
我想我现在明白你想要什么了。您永远不会用完颜色,因为matplotlib支持范围广泛的颜色定义。任何合法的HTML名称,任何RGB-三元组,.
我不知道如何有条件地为艺术家设置标签,所以下面这一部分( if)是一个可以被更多了解matplotlib内部工作的人改进的黑客。
import numpy as np
import matplotlib.pyplot as plt
def my_sin(x, a):
return a * np.sin(x)
def my_cos(x, a):
return a * np.cos(x)
def my_tanh(x, a):
return np.tanh(x / a - 1)
def plotTrig(x, data, colors, parameters):
fig, ax = plt.subplots()
for ind, a in enumerate(parameters):
for name, func in data.iteritems():
if (name == 'sin'): # or any other
ax.plot(x, func(x, a), '-',
color=colors[ind],
label='trig a={}'.format(a))
else:
ax.plot(x, func(x, a), '-',
color=colors[ind])
ax.legend()
if __name__ == '__main__':
# prepare data
x = np.arange(0,10,0.1)
data = {} # dictionary to hold the values
data['sin'] = my_sin
data['cos'] = my_cos
data['tanh'] = my_tanh
# list to hold the colors for each parameter
colors = ['burlywood', 'r', '#0000FF', '0.25', (0.75, 0, 0.75)]
# parameters
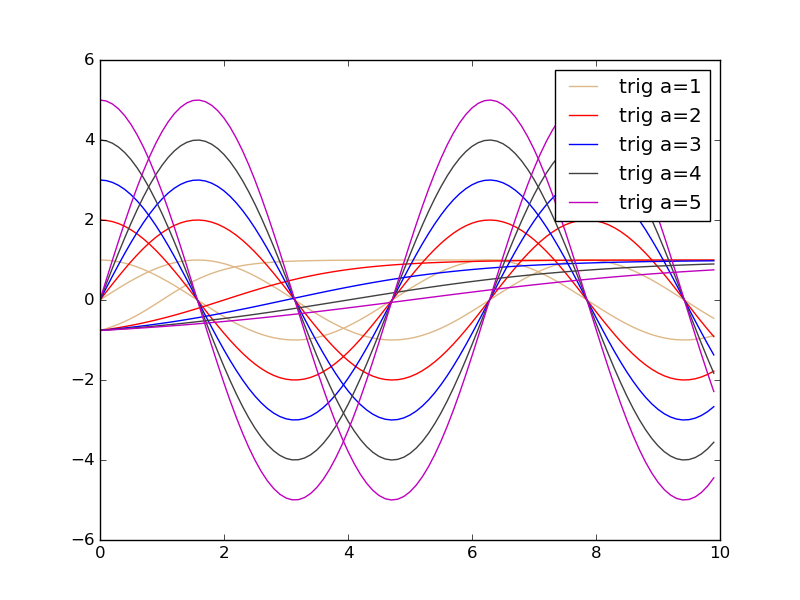
parameters = [1, 2, 3, 4, 5]
plotTrig(x, data, colors, parameters)
plt.show()其思想是将不同的函数放在容器中,这样我们就可以对它们进行迭代(列表也会工作),然后对每个函数使用相同的颜色,但对每个参数使用不同的颜色。标签只添加到一个带有if语句的函数中。
如果只是将字典值设置为函数的结果,我本来可以简单得多:
data['sin'] = np.sin(x)然后用
ax.plot(x, a * func, '-',...来再现您的示例,但是您的参数只能应用于函数的结果。通过这种方式,您可以以任何方式使用它们,您可以将它们表示为函数。
结果:
页面原文内容由Stack Overflow提供。腾讯云小微IT领域专用引擎提供翻译支持
原文链接:
https://stackoverflow.com/questions/37978542
复制相关文章
相似问题
腾讯云开发者
