
虚线不工作
我有一个单选按钮列表,表示一个国家。我希望当用户单击单选按钮时,将加载正确的线条图。为此,我有4个csv文件与每个国家的数据。
csv文件如下:
year,death,value
2012,Tuberculosis,NA
2011,Tuberculosis,NA
2010,Tuberculosis,301
2009,Tuberculosis,344
2008,Tuberculosis,333
2007,Tuberculosis,329
2006,Tuberculosis,350
2005,Tuberculosis,NA
2004,Tuberculosis,NA
2003,Tuberculosis,396
2002,Tuberculosis,413
2001,Tuberculosis,415
2000,Tuberculosis,460
1999,Tuberculosis,517
1998,Tuberculosis,558
1997,Tuberculosis,597
1996,Tuberculosis,609
1995,Tuberculosis,647
2012,Tetanus,NA
2011,Tetanus,NA
2010,Tetanus,17
2009,Tetanus,27
2008,Tetanus,18
...这里是我的代码。我不知道为什么柱塞创建错误“坏请求”。
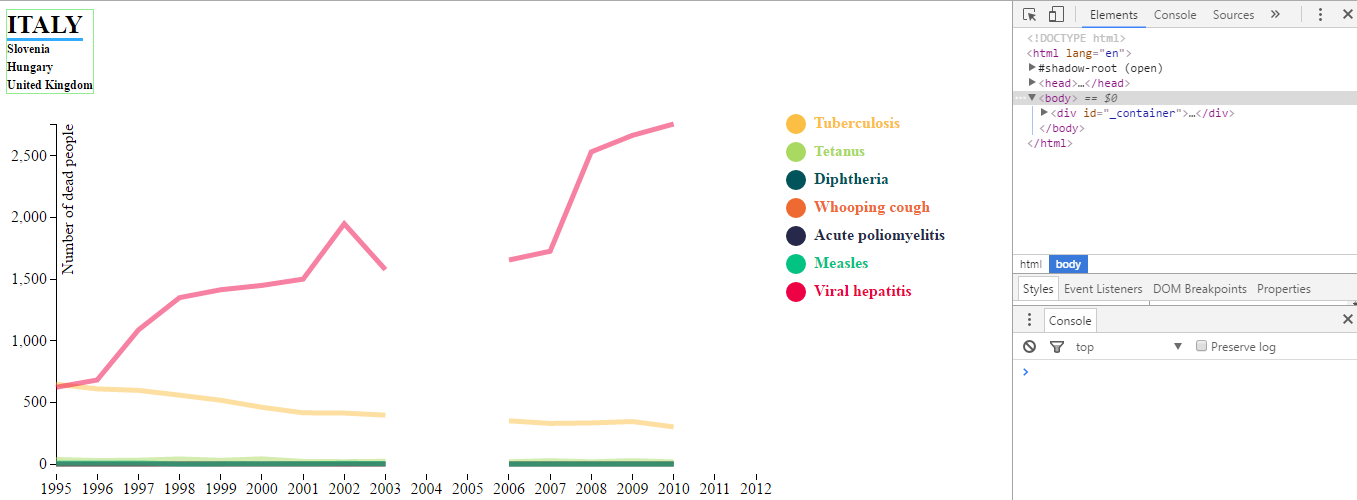
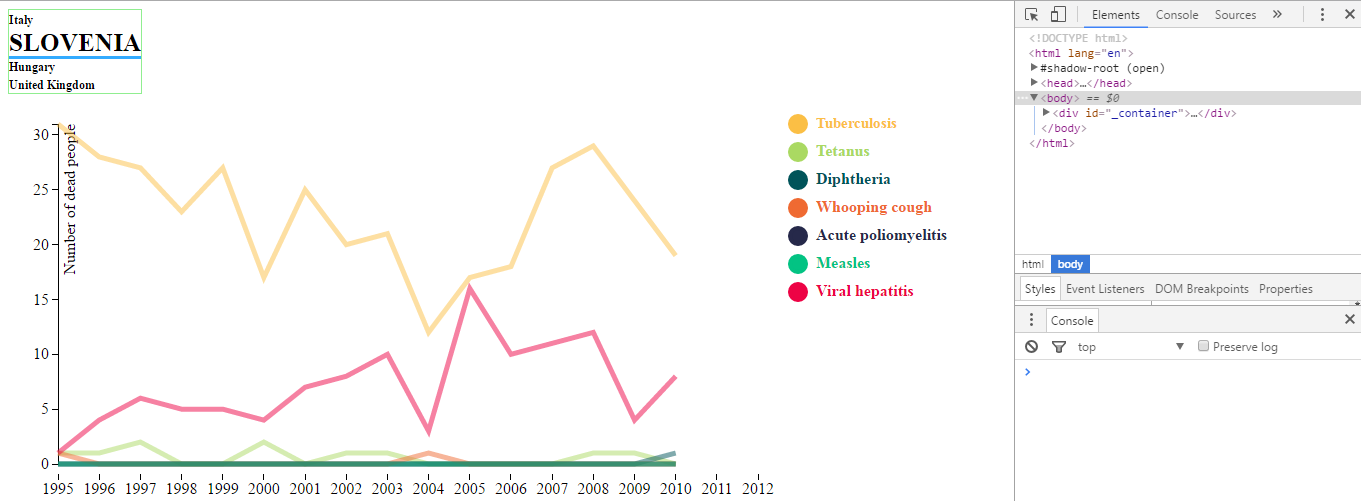
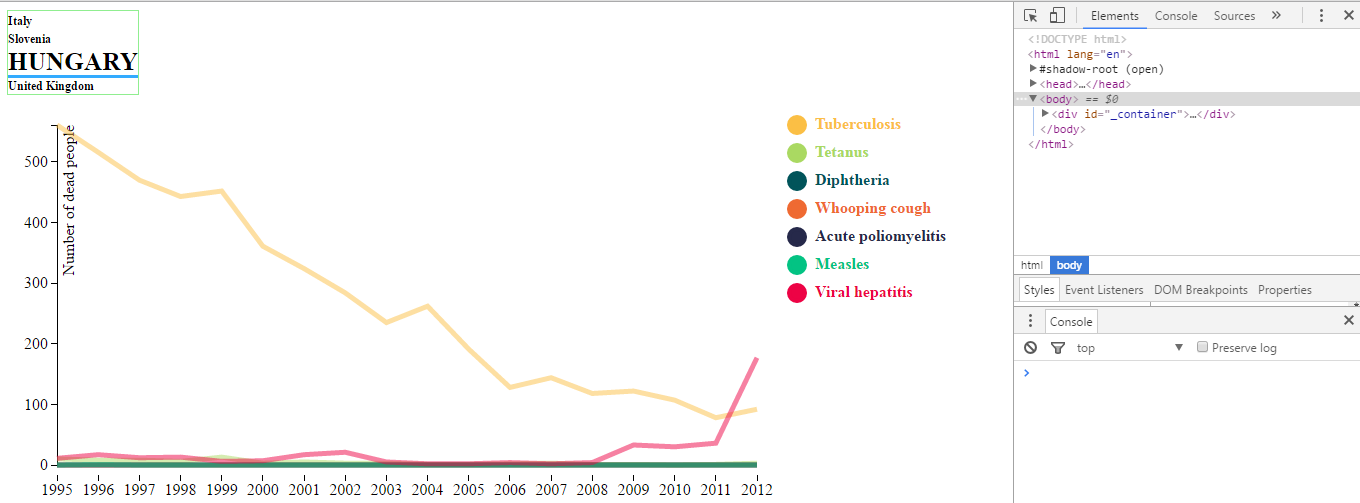
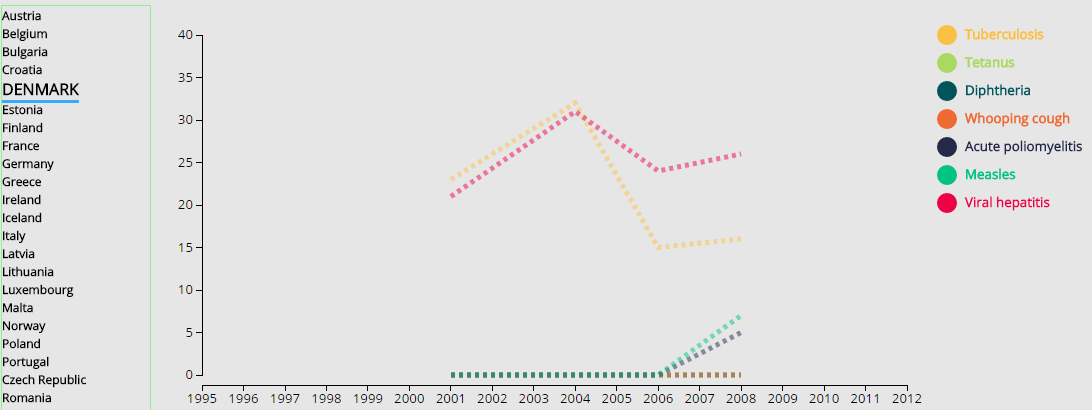
无论如何,这是我的结果:如果用户单击意大利,那么浏览器加载Italy.csv文件并创建图表,如果用户单击匈牙利,则浏览器加载Hungary.csv文件并创建图表等等。
问题是,在我的csv文件中,数据上有一些“漏洞”。例如,我没有2003年到2006年间意大利死亡人数的任何数据,所以我想用虚线代替实线。在我的图表里我做不到。特别是,我编写了代码来完成这个任务,但是它不起作用。请注意,缺失的数据将根据国家的不同而变化。对于一些国家,我拥有所有的数据,而不是其他国家的数据。
另外,如果用户单击相应系列中的圆圈(图例)消失,则圆圈应该变成白色,并且轴改变以适应当前的数据。这不管用,我也不明白为什么。
如您所见,控制台不会显示任何错误。
在这个类似的例子中,它可以工作:柱塞
我解释得很糟糕。“缺失数据”的意思是NA值。
我知道比利时的图表是正确的。我试图理解为什么丹麦的图表是这样的,但对不起,当你说“代码为每一个可泄漏的数据生成倍数路径,而只为所有NA数据生成一条路径时,它必须为数据上的每一个空白生成一个分段”。
守则的组织方式如下:
// some code...

/**************************************************************************
 *** GET SELECTED COUNTRY AND DRAW FIRST CHART ****************************
 **************************************************************************/
var l_selectedCountry = document.querySelector('input[name="l_country"]:checked').value;
l_createLineChart(l_selectedCountry);
var l_updateradio = function() {
    l_selectedCountry = $('input[name=l_country]:checked', '#l_countries').val();
    l_createLineChart(l_selectedCountry);
}
$("#l_countries").on("change", l_updateradio);

/**************************************************************************
 *** DRAW THE RIGHT CHART BASED ON SELECTED COUNTRY  **********************
 **************************************************************************/
function l_createLineChart(l_selectedCountry) {
  // remove last chart
  d3.select("#l_chartcontainer")
    .html("");

  // adds the svg canvas
  var svg = d3.select("#l_chartcontainer")
    .append("svg")
    .attr("width", l_width + margin.left + margin.right)
    .attr("height", l_height + margin.top + margin.bottom)
    .append("g")
    .attr("transform", "translate(" + margin.left + "," + margin.top + ")");

  var l_file = "./data/line_data/" + l_selectedCountry + ".csv";

  /**************************************************************************
  *** GET RIGHT DATA ********************************************************
  **************************************************************************/
  d3.csv(l_file, function(l_error, l_data) {

    l_data.forEach(function(d) {
        d.year = parseDate(d.year);
        d.value = +d.value;
    });

    // code about axis...

    /**************************************************************************
    *** GET ALL LINE DATA (solid & dashed) ************************************
    **************************************************************************/
    var l_dataNest = d3.nest()
        .key(function(d) {
            return d.death;
        })
        .entries(l_data);
    console.log("l_dataNest");
    console.log(l_dataNest);

    // code about labels...

    /**************************************************************************
    *** GET DASHED LINE DATA **************************************************
    **************************************************************************/
    var l_dashedData = l_getDashed(l_dataNest); // dashed line (extreme point) for each disease
    console.log("l_dashedData");
    console.log(l_dashedData);

    // other code...

    /**************************************************************************
    *** DRAW SOLID LINE *******************************************************
    **************************************************************************/
    svg.append('g')
      .attr('class', 'l_line-container')
      .selectAll('.normal-line-paths')
      .data(l_dataNest) // set our data
      .enter() // enter the data and start appending elements
      .append('path')
      .call(l_path); // calling our path function for later use when appending lines

    /**************************************************************************
    *** DRAW DASHED LINE ******************************************************
    **************************************************************************/
    svg.append('g')
      .attr('class', 'dashed-line-container')
      .selectAll('.dashed-line-paths')
      .data(l_dashedData)
      .enter()
      .append('path')
      .call(l_dashedPath);

    // other code...
  });
}

// code about event...

function l_path(myPath) {
  myPath.style("fill", "none")
    .style("stroke", function(d) {
        return l_color[d.key];
    })
    .attr('class', function(d) {
        return 'normal-line-paths path-' + d.key.replace(/\s+/g, '');
    })
    .attr("d", function(d) {
        return valueline(d.values);
    })
    .style("opacity", 0.5)
    .on("mouseover", l_onMouseOverLine)
    .on("mouseout", l_onMouseOutLine);
}

function l_dashedPath(myPath) {
  myPath.style("fill", "none")
    .style("stroke", function(d) {
        return l_color[d.key];
    })
    .style("stroke-width", 5)
    .attr("stroke-dasharray", '4')
    .attr('class', function(d) {
        return 'dashed-line-paths path-' + d.key.replace(/\s+/g, '');
    })
    .attr("d", function(d) {
        return valueline(d.values);
    })
    .style("opacity", 0.5)
    .on("mouseover", l_onMouseOverLine)
    .on("mouseout", l_onMouseOutLine);
}

/**
 * Function to return the data points that will create the dashed lines.
 */
function l_getDashed(data) {
  return data.map(function(collection, index) {
    var l_startNaN = false;
    var l_dashed = {
     key: collection.key, // disease
     values: [] //array of death, death and year
    };
    collection.values.forEach(function(dataPoint, index) {
      var l_value = dataPoint.value;
      var values = collection.values;
      if($.isNumeric(l_value) && l_startNaN) {
        l_startNaN = false;
       l_dashed.values.push(values[index]);
      }
      else {
       if(($.isNumeric(l_value) && l_startNaN) || (!$.isNumeric(l_value) && !l_startNaN)) {
          l_startNaN = true;
          l_dashed.values.push(values[index-1]);
        }
      }
    })
    if((l_dashed.values.length % 2)) {
      l_dashed.values.pop();
    }
    return l_dashed;
  });
}
如果我评论这段代码:
// apend a group element which will contain our dashed lines
/*svg.append('g')
    .attr('class', 'dashed-line-container')
    .selectAll('.dashed-line-paths')
    .data(l_dashedData)
    .enter()
    .append('path')
    .call(l_dashedPath);*/
我得到:
如果我评论一下:
// apend a group element which will contain our lines
/*svg.append('g')
    .attr('class', 'l_line-container')
    .selectAll('.normal-line-paths')
    .data(l_dataNest) // set our data
    .enter() // enter the data and start appending elements
    .append('path')
    .call(l_path); */
我得到:
因此,在l_dashedPath(myPath)方法中肯定存在一个问题。但是,如果我打印d,我得到两个部分的四个末端(肺结核):23,32,15,16是正确的。
.attr("d", function(d) {
    console.log(d);
    return valueline(d.values);
})而且,l_getDashed(data)方法在我看来是正确的。
回答 1
Stack Overflow用户
发布于 2016-07-03 16:21:10
在柱塞中,文件名上不能有空间。将'United Kingdom.csv'重命名为带有下划线(_)左右的东西。"United_Kingdom.csv"
您的函数l_getdashed,不要为每个虚线段取下一个点。最后,你只得到一个点,而不是一个片段。
我要重新改造你的职能:
function l_getDashed(data) {
    return data.map(function(collection, index) {
        var l_startNaN = false;
        var l_dashed = {
            key: collection.key,
            values: []
        };
        collection.values.forEach(function(dataPoint, index) {
            var l_value = dataPoint.value;
            var values = collection.values;

            if ($.isNumeric(l_value) && l_startNaN) {
                l_startNaN = false;
                l_dashed.values.push(values[index]);
            } else if ( !$.isNumeric(l_value) !== l_startNaN) {
                l_startNaN = true
                l_dashed.values.push(values[index-1]);
            }
        })
        if (l_dashed.values.length % 2) { l_dashed.values.pop() }
        return l_dashed;
    });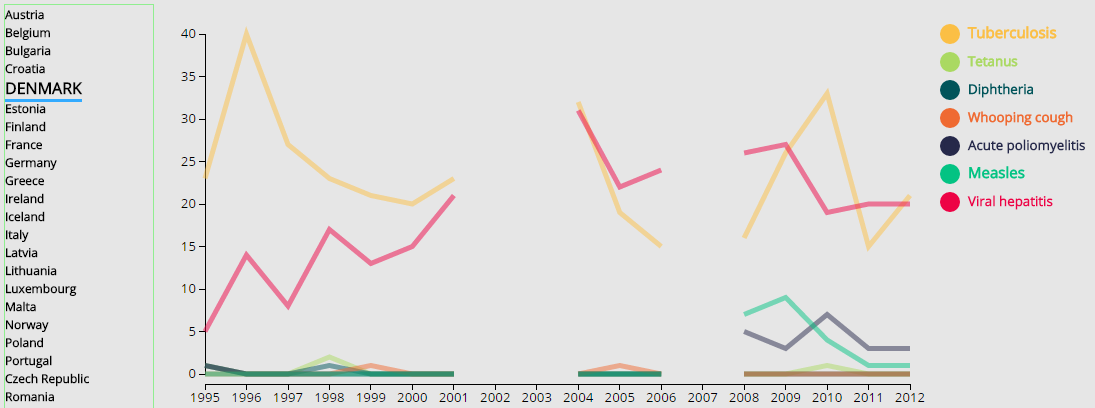
} 丹麦
您的代码存在概念错误。这就是为什么你看到‘丹麦’这样的。
图形化:
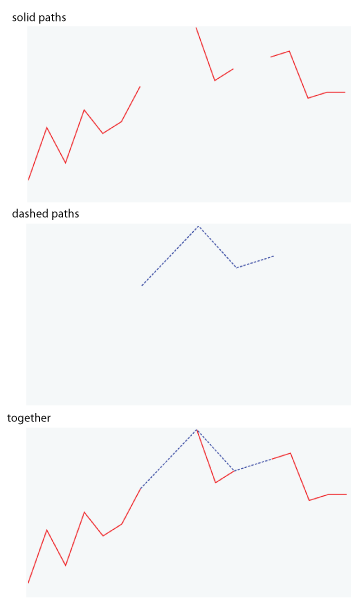
代码为每个可转移的数据生成多个路径,为所有NA数据生成一个路径。相反,它必须为数据上的每一个空白生成一个分段。
比利时
贝尔金姆是一部不同的历史。图是好的,你的数据有独立的点(红点),不能被忽略。
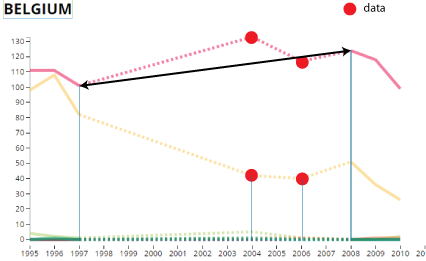
你不能画一个虚线从1997-2009 (黑色箭头),因为你将放弃数据。
https://stackoverflow.com/questions/38171635
复制相似问题
腾讯云开发者

Copyright © 2013 - 2026 Tencent Cloud. All Rights Reserved. 腾讯云 版权所有
深圳市腾讯计算机系统有限公司 ICP备案/许可证号:粤B2-20090059 ![]() 粤公网安备44030502008569号
粤公网安备44030502008569号
腾讯云计算(北京)有限责任公司 京ICP证150476号 | 京ICP备11018762号