
LightningChart中的串行数据绑定
LightningChart中的串行数据绑定
提问于 2016-07-06 05:45:22
我看到在LightningChart中有3个WPF API可用。可绑定/半绑定和不可绑定。他们到底有什么区别?
如何将数据点的集合绑定成线状图?
回答 1
Stack Overflow用户
发布于 2016-07-07 18:56:04
- Bindable图表API:DependencyProperties,基于观察者集合的列表和数据输入.把一切都绑起来。在XAML中配置。与竞争对手相比表现良好,但不如半绑定或不可绑定。性能差异特别显示在使用数百个系列和数百万个数据点时。
- **Semi-bindable chart API**: DependencyProperties, ObservableCollections in  lists. Data input is array-based and must be done in code-behind. So you can bind UI settings and chart objects, but just feed the data in code. Very good performance.
- **Non-bindable chart API**: No DependencyProperties, no ObservableCollections in any lists or data inputs. Regular properties and usage in code-behind. Best performance and multithreading features. Over billion points can be monitored in real-time monitoring as our [demo application](http://arction.com/billion_data_points_visualization) shows.
使用Bindable图表API,您可以配置图表并像这样绑定
<Window x:Class="BindingExamplePointLineSeries.MainWindow"
    xmlns="http://schemas.microsoft.com/winfx/2006/xaml/presentation"
    xmlns:x="http://schemas.microsoft.com/winfx/2006/xaml"
    xmlns:lcub="http://schemas.arction.com/bindablecharting/ultimate/"
    x:Name="thisTest"
    Title="MainWindow" Height="350" Width="525">
<Grid>
    <lcub:LightningChartUltimate>
        <lcub:LightningChartUltimate.ViewXY>
            <lcub:ViewXY>
                <lcub:ViewXY.YAxes>
                    <lcub:AxisY/>
                </lcub:ViewXY.YAxes>
                <lcub:ViewXY.XAxes>
                    <lcub:AxisX/>
                </lcub:ViewXY.XAxes>
                <lcub:ViewXY.PointLineSeries>
                    <lcub:PointLineSeries Points="{Binding ElementName=thisTest, Path = Points}" PointsVisible="True"/>
                </lcub:ViewXY.PointLineSeries>
            </lcub:ViewXY>
        </lcub:LightningChartUltimate.ViewXY>
    </lcub:LightningChartUltimate>
</Grid>
public partial class MainWindow : Window
{
public MainWindow()
{
InitializeComponent();
Random rand = new Random();
SeriesPointCollection points0 = new SeriesPointCollection();
for (int i = 0; i < 10; i++)
{
SeriesPoint p = new SeriesPoint();
p.X = i;
p.Y = rand.NextDouble() * 10.0;
points0.Add(p);
}
Points = points0;
}
public static readonly DependencyProperty PointsProperty =
DependencyProperty.Register(
"Points",
typeof(SeriesPointCollection),
typeof(MainWindow)
);
public SeriesPointCollection Points
{
get { return GetValue(PointsProperty) as SeriesPointCollection; }
set { SetValue(PointsProperty, value as Object); }
}
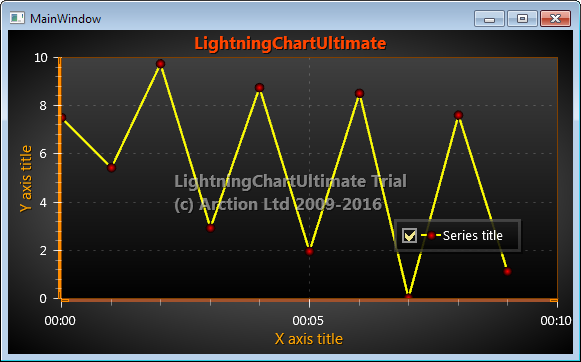
}然后得到数据绑定的图表:
页面原文内容由Stack Overflow提供。腾讯云小微IT领域专用引擎提供翻译支持
原文链接:
https://stackoverflow.com/questions/38217015
复制相关文章
相似问题
腾讯云开发者
