
列表中的热图
列表中的热图
提问于 2016-07-20 07:43:39
我有一个列表x,它包含0到1之间的强度,我想要创建一个带有平方网格的热图。
例如:
x = [0, 0.1, 0, 0.5, ..., 0.5]
n = len(x)
dim = math.sqrt(n) + 1但是,如何使用dim × dim (不可用的最后值可能为零)创建数组并创建指定大小的热图(例如,1024×769)?
回答 1
Stack Overflow用户
回答已采纳
发布于 2016-07-20 08:19:28
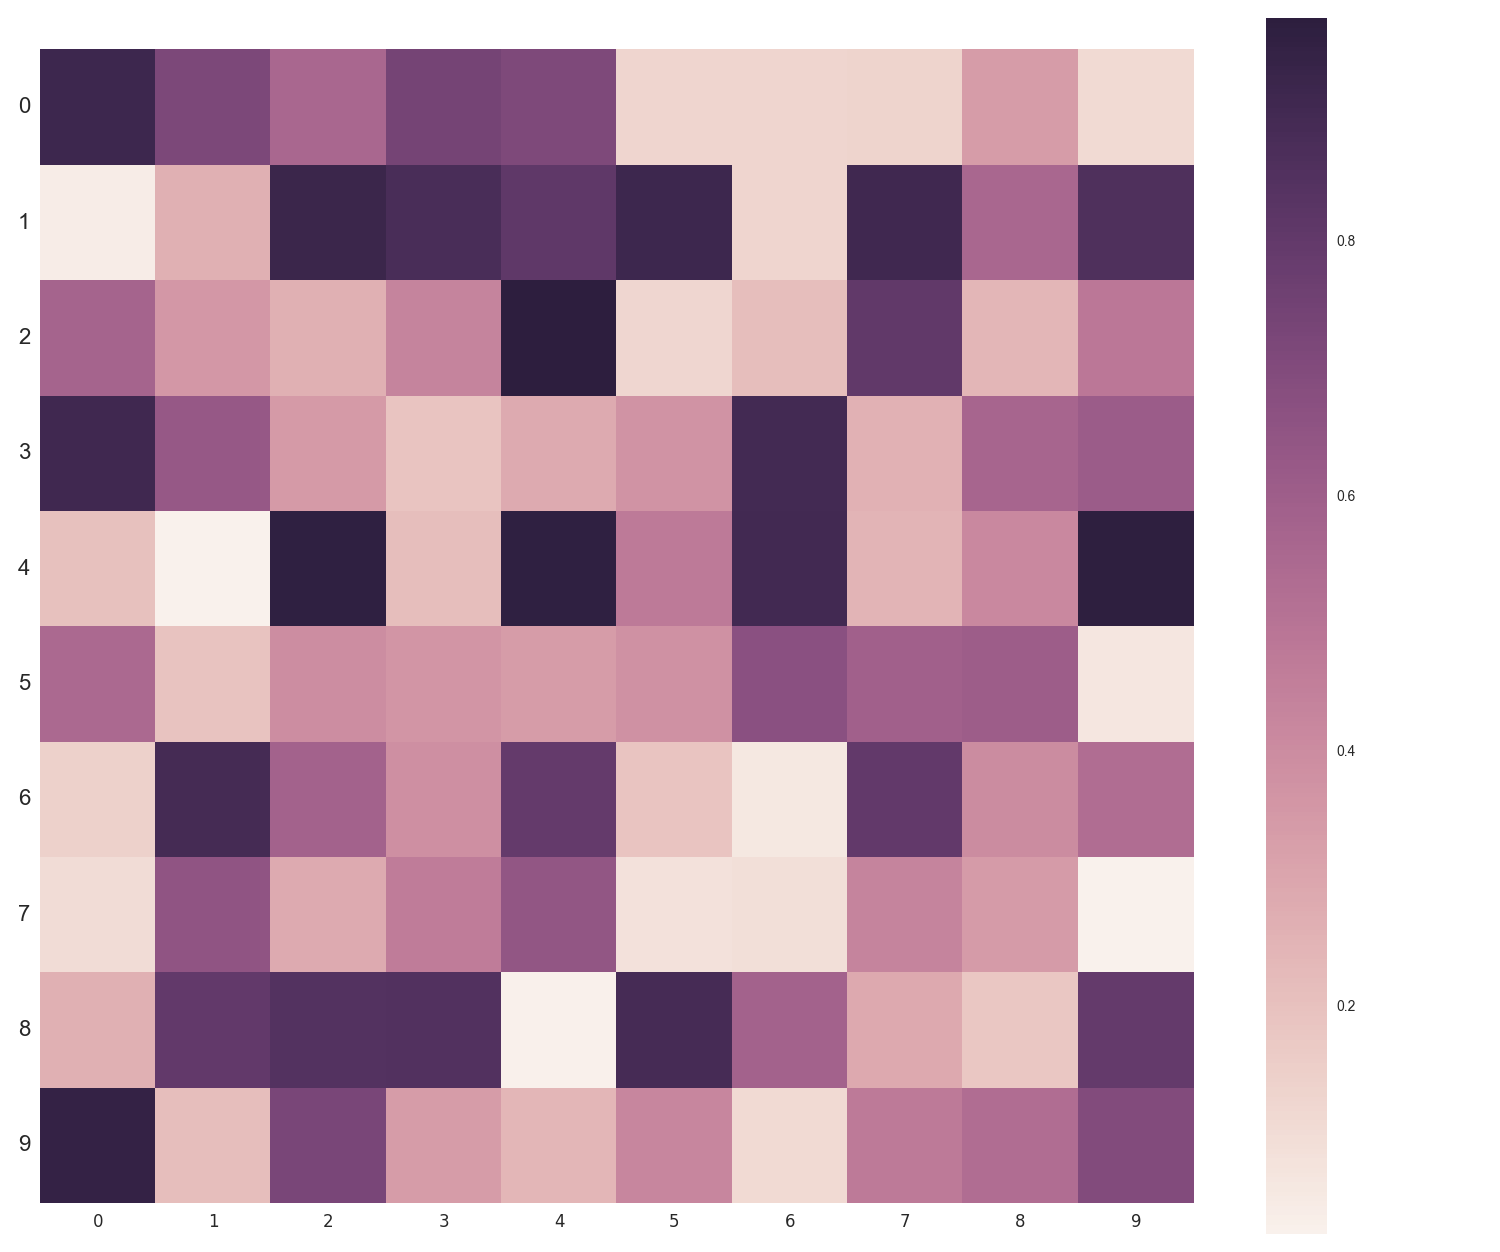
正如注释中提到的,您可以使用numpy,并在海运的帮助下进行绘图:
import numpy as np
import math
import matplotlib.pyplot as plt
import seaborn as sns

x_list = np.random.rand(100).tolist()
x = np.array((x_list))
# x_res=x.reshape(math.sqrt(len(x)),math.sqrt(len(x))) #old
x_res=x.reshape(int(math.sqrt(len(x))),int(math.sqrt(len(x))))

fig, ax = plt.subplots(figsize=(15,15))
sns.heatmap(x_res, square=True, ax=ax)
plt.yticks(rotation=0,fontsize=16);
plt.xticks(fontsize=12);
plt.tight_layout()
plt.savefig('colorlist.png')
产
页面原文内容由Stack Overflow提供。腾讯云小微IT领域专用引擎提供翻译支持
原文链接:
https://stackoverflow.com/questions/38475268
复制相关文章
相似问题
腾讯云开发者
