
X轴在R中的x轴值
X轴在R中的x轴值
提问于 2016-08-11 14:33:25
在R中,我希望使用xyplot来绘制向量b与向量a (两者均为8)之间的值。
是否有可能在x轴上有从0到10的范围,这样两个向量就可以互相作图了吗?现在x轴从1转到8。
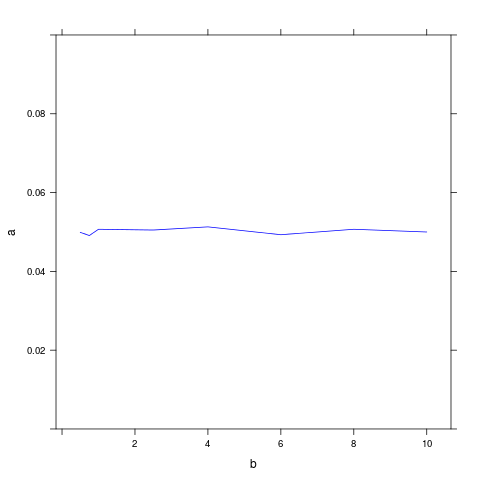
b <- c(0.5, 0.75, 1, 2.5, 4, 6, 8, 10)
a <- c(0.0499, 0.0491, 0.0507, 0.0505, 0.0513, 0.0493, 0.0507, 0.0500)
library(lattice)
xyplot(a ~1:8, type="l", col="blue", ylim=c(0,0.10))
编辑:
我的意思是,我们有一条直线经过坐标(0.5,0.0409);(0.75,0.0491);(1,0.0507)等等。
回答 2
Stack Overflow用户
回答已采纳
发布于 2016-08-11 14:36:23
如果您想将组件绘制成相互对应的图,只需
xyplot(a~b, type="l", col="blue", ylim=c(0,0.1))
Stack Overflow用户
发布于 2016-08-11 14:37:36
不确定我是否正确地理解了您的问题,但是如果您只是试图将x轴调整为0到10,只需添加xlim=c(0,10),那么最后一行将是xyplot(a ~1:8, type="l", col="blue", ylim=c(0,0.10), xlim=c(0,10))。
页面原文内容由Stack Overflow提供。腾讯云小微IT领域专用引擎提供翻译支持
原文链接:
https://stackoverflow.com/questions/38899305
复制相关文章
相似问题
腾讯云开发者
