
如何在python中用两个数组绘制叠加直方图
如何在python中用两个数组绘制叠加直方图
提问于 2016-09-09 10:14:49
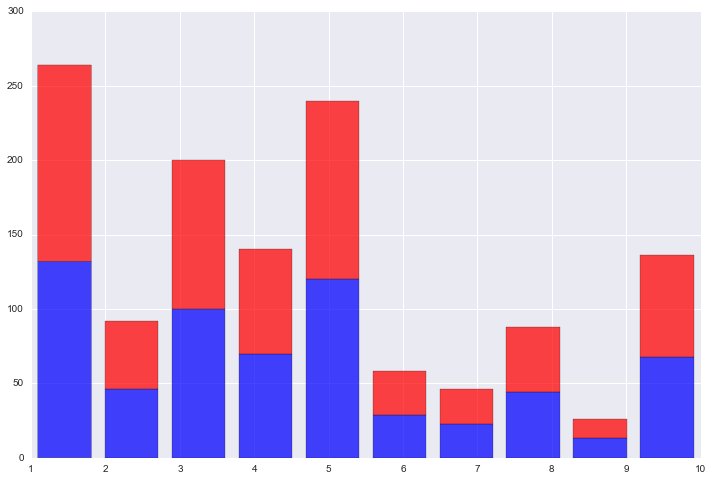
我试图创建一个叠加的直方图,显示恶性肿瘤和良性肿瘤的肿块厚度,其中恶性类为红色,良性类为蓝色。
我拿到了clump_thickness_array和benign_or_malignant_array。benign_or_malignant_array由2s和4s组成。
- 如果benign_or_malignant =2,则为良性(蓝色)。
- 如果它等于4,它是恶性的(红色)。
我不知道如何对良性肿瘤和恶性肿瘤进行着色。我的直方图显示的不是我想要达到的目标。
到目前为止,这是我的代码和直方图:
fig, ax = plt.subplots(figsize=(12,8))
tmp = list()
for i in range(2):
indices = np.where(benign_or_malignant>=i )
tmp.append(clump_thickness[indices])

ax.hist(tmp,bins=10,stacked=True,color = ['b',"r"],alpha=0.73)
回答 1
Stack Overflow用户
回答已采纳
发布于 2016-09-09 12:42:38
若要使用每个组的不同长度的列表获得叠加直方图,您需要组装一个列表列表。这就是您对tmp变量所做的操作。但是,我认为您在for循环中使用了错误的索引。上面,您声明要根据变量benign_or_malignant对数据进行标记。你想要测试它到底是2还是正好4。如果你真的想要这两种可能性,就重写如下:
for i in [2,4]:
   indices = np.where(benign_or_malignant==i )
tmp.append(clump_thickness[indices])页面原文内容由Stack Overflow提供。腾讯云小微IT领域专用引擎提供翻译支持
原文链接:
https://stackoverflow.com/questions/39409187
复制相关文章
相似问题
腾讯云开发者
