
用Cimg在C++中绘制矢量
用Cimg在C++中绘制矢量
提问于 2016-09-09 14:36:54
作为一个项目的一部分,我现在正在工作,我需要绘制一个类似MATLAB风格的向量。在研究了一些可能性之后,我发现了CIMG,它看起来很容易投入到我的程序中,正好适合我需要的东西。我在C++非常新,以前从未使用过Cimg。
按照指南中提供的示例之一,我在这个程序中绘制了向量(在本例中称为ecg_r),我的代码如下所示:
// Read command line argument   cimg_usage("Simple plotter of ECG signal");
const char *const formula = cimg_option("-f", "x", "Formula to plot");
const float x0 = cimg_option("-x0", 0.0f, "Minimal X-value");
const float x1 = cimg_option("-x1", 20.0f, "Maximal X-value");
int sizeecg = ecg_r.size();
const int resolution = cimg_option("-r", sizeecg, "Plot resolution");
const unsigned int nresolution = resolution>1 ? resolution : sizeecg;
const unsigned int plot_type = cimg_option("-p", 1, "Plot type");
const unsigned int vertex_type = cimg_option("-v", 1, "Vertex type");

// Create plot data.
CImg<double> values(1, nresolution, 1, 1, 0);

const unsigned int r = nresolution - 1;

for (int i1 = 0; i1 < sizeecg; ++i1)
{
    double xtime = x0 + i1*(x1 - x0) / r;
    values(0, i1) = ecg_r.at(i1);
}

// Display interactive plot window.
values.display_graph(formula, plot_type, vertex_type, "X-axis", x0, x1, "Y-axis");
我在创建的“显示”窗口中看到的图像正是我所期望的,但是当我试图使用以下方法保存bmp中的图像时:
values.save_bmp("test.bmp");图像完全是黑色的,如何保存我在显示功能中看到的图像?昨天下午,我翻了一遍文档,却找不到线索。
谢谢你提前..。
这是我想要做的MCVE,我希望能够保存在bmp中,我在显示窗口中看到的东西。谢谢
#include "CImg.h"
#include <vector>

using namespace cimg_library;

int main(int argc, char** const argv)
{
    cimg_usage("Simple plotter of mathematical formulas");
    const char *const formula = cimg_option("-f", "sin(x)", "Formula to    plot");
    const float x0 = cimg_option("-x0", -5.0f, "Minimal X-value");
    const float x1 = cimg_option("-x1", 5.0f, "Maximal X-value");
    const int resolution = cimg_option("-r", 5000, "Plot resolution");
    const unsigned int nresolution = resolution>1 ? resolution : 5000;
    const unsigned int plot_type = cimg_option("-p", 1, "Plot type");
    const unsigned int vertex_type = cimg_option("-v", 1, "Vertex type");

    // Create plot data.
    CImg<double> values(1, nresolution, 1, 1, 0);

    const unsigned int r = nresolution - 1;

    for (int i1 = 0; i1 < resolution; ++i1)
    {
        double xtime = x0 + i1*(x1 - x0) / r;
        values(0, i1) = sin(xtime);
    }

    CImg<double> values2;
    values2 = values.display_graph(formula, plot_type, vertex_type, "X Axis", x0, x1, "Y Axis");
    values.normalize(0, 255);
    values.save_bmp("test.bmp");

}回答 1
Stack Overflow用户
回答已采纳
发布于 2016-09-12 07:56:55
更新答案
你完全错了马克!你可以拍一张这样的情节快照。
#include "CImg.h"
#include <vector>

using namespace cimg_library;

int main(int argc, char** const argv)
{
    cimg_usage("Simple plotter of mathematical formulas");
    const char *const formula = cimg_option("-f", "sin(x)", "Formula to    plot");
    const float x0 = cimg_option("-x0", -5.0f, "Minimal X-value");
    const float x1 = cimg_option("-x1", 5.0f, "Maximal X-value");
    const int resolution = cimg_option("-r", 5000, "Plot resolution");
    const unsigned int nresolution = resolution>1 ? resolution : 5000;
    const unsigned int plot_type = cimg_option("-p", 1, "Plot type");
    const unsigned int vertex_type = cimg_option("-v", 1, "Vertex type");

    // Create plot data.
    CImg<double> values(1, nresolution, 1, 1, 0);

    const unsigned int r = nresolution - 1;

    for (int i1 = 0; i1 < resolution; ++i1)
    {
        double xtime = x0 + i1*(x1 - x0) / r;
        values(0, i1) = sin(xtime);
    }

    CImgDisplay disp;
    CImg<double> values2;
    values.display_graph(disp, plot_type, vertex_type, "X Axis", x0, x1, "Y Axis");
    disp.snapshot(values2);
    values2.save_bmp("result.bmp");
}
原始答案
我很高兴被告知我完全错了,如果有人知道的更好,并为我们指明了方向,但我不相信CImg会给你提供一个你想要的位图文件。
所以,我玩了一个用gnuplot来做这件事的游戏。您的图像在屏幕上如下所示:
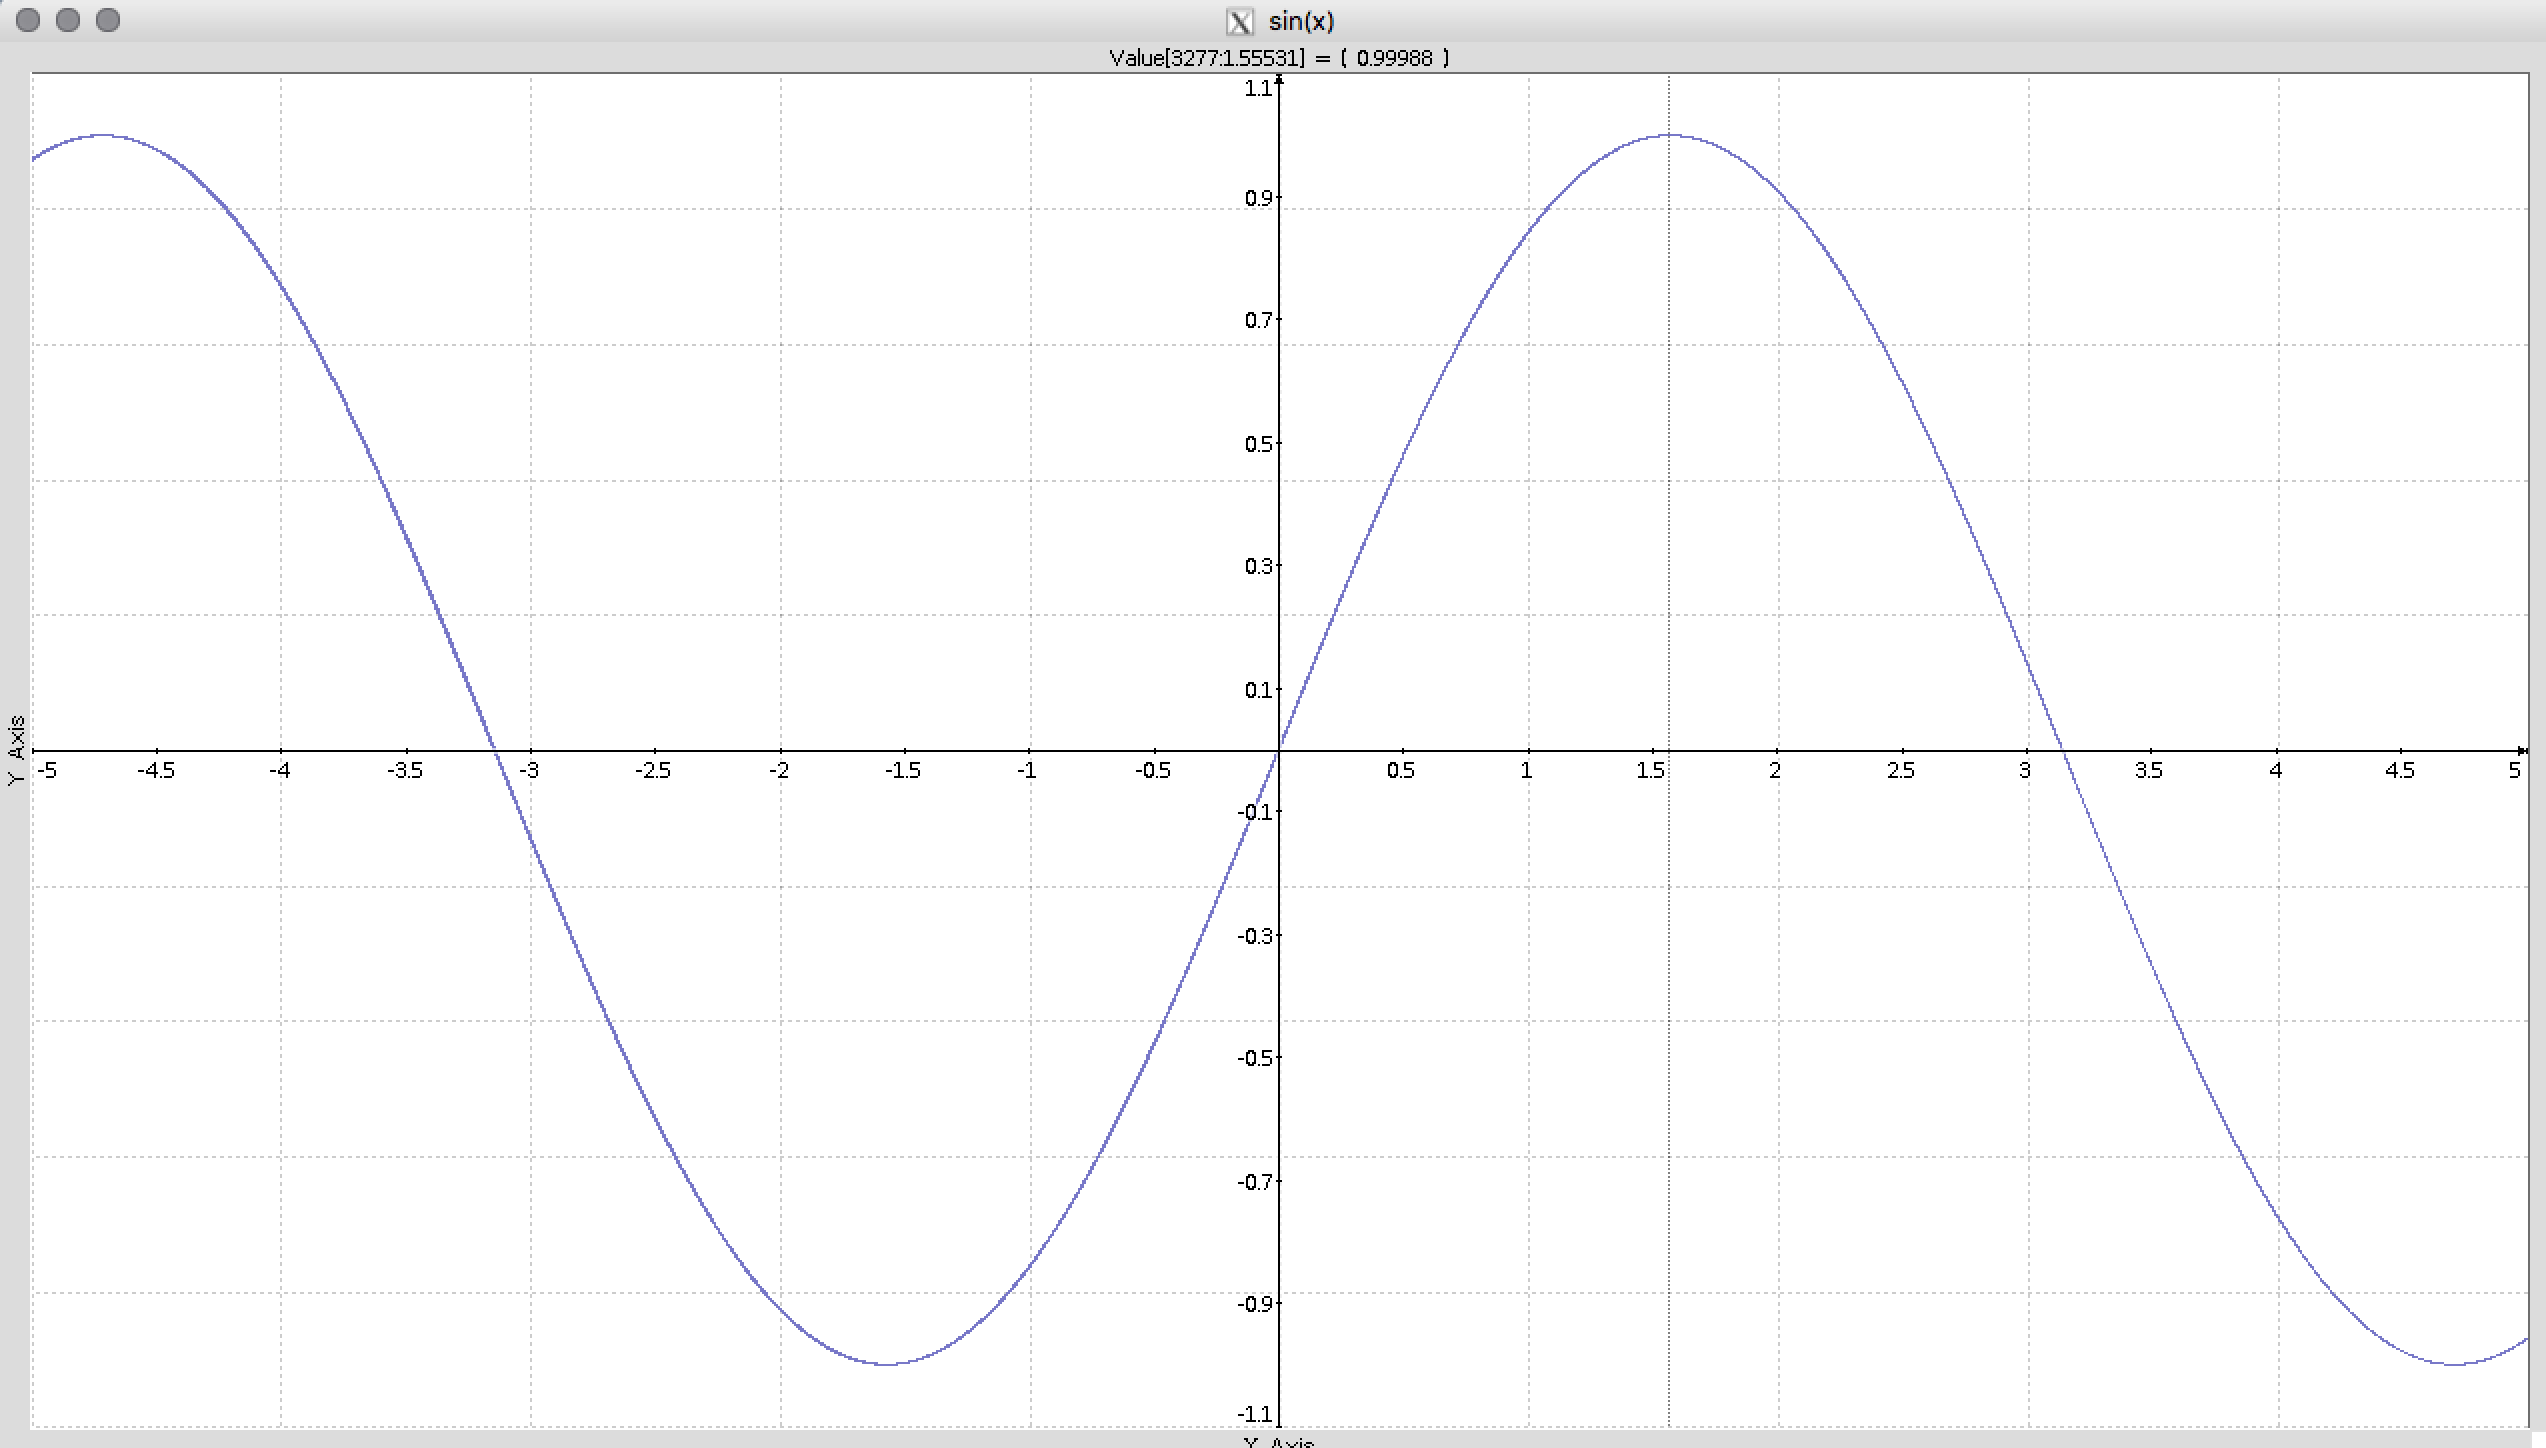
因此,粗略地说,如果您对代码做了一些编辑,如下所示:
#include "CImg.h"
#include <iostream>
#include <fstream>
#include <vector>
using namespace cimg_library;
using namespace std;
int main(int argc, char** const argv)
{
cimg_usage("Simple plotter of mathematical formulas");
const char *const formula = cimg_option("-f", "sin(x)", "Formula to plot");
const float x0 = cimg_option("-x0", -5.0f, "Minimal X-value");
const float x1 = cimg_option("-x1", 5.0f, "Maximal X-value");
const int resolution = cimg_option("-r", 5000, "Plot resolution");
const unsigned int nresolution = resolution>1 ? resolution : 5000;
const unsigned int plot_type = cimg_option("-p", 1, "Plot type");
const unsigned int vertex_type = cimg_option("-v", 1, "Vertex type");
// Create plot data.
CImg<double> values(1, nresolution, 1, 1, 0);
const unsigned int r = nresolution - 1;
ofstream data;
data.open("plot.dat");
for (int i1 = 0; i1 < resolution; ++i1)
{
double xtime = x0 + i1*(x1 - x0) / r;
values(0, i1) = sin(xtime);
double x=x0 + i1*(x1-x0)/nresolution;
data << x << " " << values(0,i1) << endl;
}
data.close();
CImg<double> values2;
values2 = values.display_graph(formula, plot_type, vertex_type, "X Axis", x0, x1, "Y Axis");
cout << "set terminal png size 900,600 enhanced font \"Helvetica,20\"" << endl;
cout << "set output 'out.png'" << endl;
cout << "set xrange [" << x0 << ":" << x1 << "]" << endl;
cout << "set grid" << endl;
cout << "set ylabel 'Y Axis'" << endl;
cout << "set xlabel 'X Axis'" << endl;
cout << "plot \"plot.dat\" with linespoint lc 4" << endl;
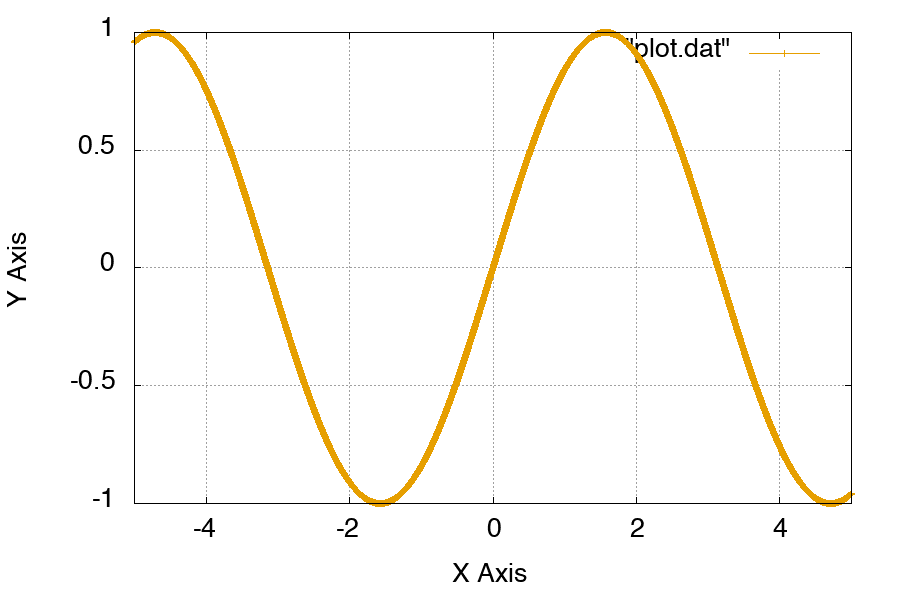
}然后像这样运行:
./yourProgram | gnuplot你会得到这个:
页面原文内容由Stack Overflow提供。腾讯云小微IT领域专用引擎提供翻译支持
原文链接:
https://stackoverflow.com/questions/39414084
复制相关文章
相似问题
腾讯云开发者
