
从rhandsontable对象(R,R闪亮)中检索值
从rhandsontable对象(R,R闪亮)中检索值
提问于 2016-09-21 20:24:15
我使用(令人敬畏的)包rhandsontable,稍后将包含在R闪亮的网页中。用户可以在某些地方单击,我想知道如何检索单击了哪些行的信息。下面是一个示例(在R终端中复制和粘贴):
library(rhandsontable)
## Create the dataset
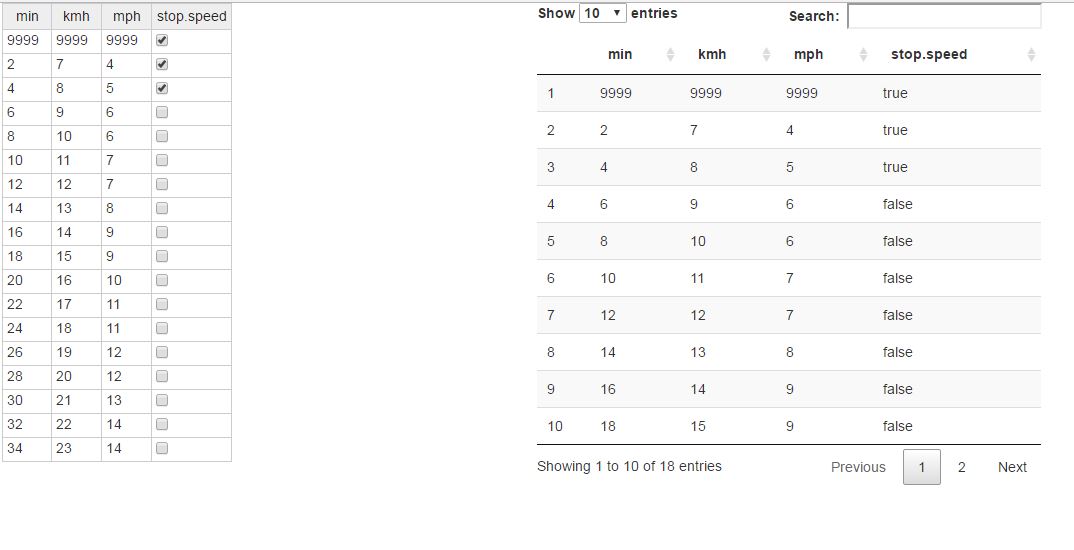
min = c(1,seq(2,34,by=2))
kmh = c(0,seq(7,23,by=1))
mph = round( kmh / 1.609344, digits=0 )
stop.speed = rep(FALSE, length(min))
DF = data.frame(min, kmh, mph, stop.speed, stringsAsFactors = FALSE)
#plot the table
r = rhandsontable(DF, useTypes = TRUE)我考虑将其转换为R对象:
hot_to_r(r)

Error in (function (data, changes, params, ...)  :
argument "params" is missing, with no default回答 5
Stack Overflow用户
回答已采纳
发布于 2019-06-01 21:54:47
这个问题已经存在4年了,但仍然适用于rhandsontable包用户。而且,由Lyx提供的解决方案不再起作用。以下是解决这个问题的简单方法。
每个rhandsontable对象都是一个深嵌套的列表。其元素之一是data元素,它本身嵌套在x元素下。但是,数据是json格式的,但是可以通过使用jsonlite包中的fromJSON()函数轻松地将其转换为jsonlite。
library(rhandsontable)
library(jsonlite)

hands_on_table <- rhandsontable(mtcars)
data_frame <- fromJSON(hands_on_table$x$data)
head(data_frame)

   mpg cyl disp  hp drat    wt  qsec vs am gear carb
1 21.0   6  160 110 3.90 2.620 16.46  0  1    4    4
2 21.0   6  160 110 3.90 2.875 17.02  0  1    4    4
3 22.8   4  108  93 3.85 2.320 18.61  1  1    4    1
4 21.4   6  258 110 3.08 3.215 19.44  1  0    3    1
5 18.7   8  360 175 3.15 3.440 17.02  0  0    3    2
6 18.1   6  225 105 2.76 3.460 20.22  1  0    3    1
编辑:
还需要指出的是,使用hot_to_r和jsonlite::fromJSON的主要区别在于,前者是在应用程序运行时使用的,而后者只在交互式R会话中工作。
Stack Overflow用户
发布于 2016-12-29 22:53:18
一旦进入这个闪亮的应用程序,你就可以使用:
input$table_select$select$r # access the row number
input$table_select$select$c # access the column number
input$table_select$data[[input$table_select$select$r]][[input$table_select$select$c]] # access the data in a cell
您可以编写一个小函数,将行号和列号“转换”为dataframe/matrix/etc中的一个位置,或者只访问上面的值。
希望这能有所帮助。
Stack Overflow用户
发布于 2016-09-22 07:37:03
请看一下shinysky包。请注意,我还显示了包含已实现的更改的表,以便您可以检查您的工作。
rm(list = ls())
library(shiny)
library(shinysky)

## Create the dataset
min = c(1,seq(2,34,by=2))
kmh = c(0,seq(7,23,by=1))
mph = round( kmh / 1.609344, digits=0 )
stop.speed = rep(FALSE, length(min))
DF = data.frame(min, kmh, mph, stop.speed, stringsAsFactors = FALSE)

server <- shinyServer(function(input, output, session) {

  # Initiate your table
  previous <- reactive({DF})

  MyChanges <- reactive({
    if(is.null(input$hotable1)){return(previous())}
    else if(!identical(previous(),input$hotable1)){
      # hot.to.df function will convert your updated table into the dataframe
      as.data.frame(hot.to.df(input$hotable1))
    }
  })
  output$hotable1 <- renderHotable({MyChanges()}, readOnly = F)
  # You can see the changes you made
  output$tbl = DT::renderDataTable(MyChanges())
})

ui <- basicPage(mainPanel(column(6,hotable("hotable1")),column(6,DT::dataTableOutput('tbl'))))
shinyApp(ui, server)
页面原文内容由Stack Overflow提供。腾讯云小微IT领域专用引擎提供翻译支持
原文链接:
https://stackoverflow.com/questions/39625954
复制相关文章
相似问题
腾讯云开发者
