
两列柱状图,柱状图上有值
昨天我提出了一个类似的问题(this one)。我无法在条形图的柱状图上显示值。我失去了很多时间,因为我找不到很好的文档,而且我只能在不同的网站上找到类似的问题。
我在这方面损失了很多时间,但幸运的是有人给了我解决办法。现在,我有一个类似的问题,一个有两个条形的柱状图,在其中,我必须把它的值放在两个条形图的顶部。我很接近,或者这就是我所想的,但我无法使它正常工作。我正在修改脚本并多次重新生成图形,但我不确定我在做什么。
script.sh
#!/usr/bin/gnuplot
set term postscript
set terminal pngcairo nocrop enhanced size 600,400 font "Siemens Sans,8"
set termoption dash
set output salida
set boxwidth 0.8 absolute
set border 1
set style fill solid 1.00 border lt -1
set key off
set style histogram clustered gap 1 title textcolor lt -1
set datafile missing '-'
set style data histograms
set xtics border in scale 0,0 nomirror autojustify
set xtics norangelimit
set xtics ()
unset ytics
set title titulo font 'Siemens Sans-Bold,20'
set yrange [0.0000 : limite1] noreverse nowriteback
set y2range [0.0000 : limite2] noreverse nowriteback
show style line
set style line 1 lt 1 lc rgb color1 lw 1
set style line 2 lt 1 lc rgb color2 lw 1
## Last datafile plotted: "immigration.dat"
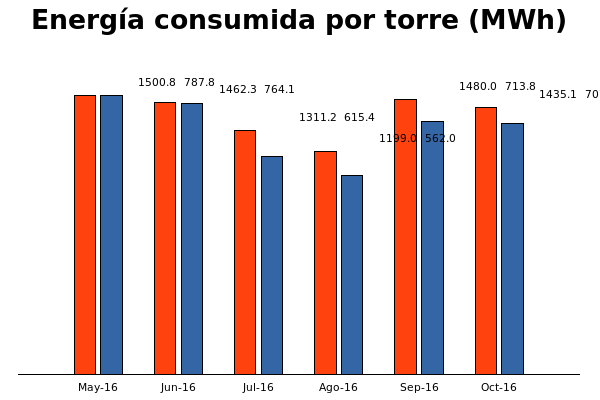
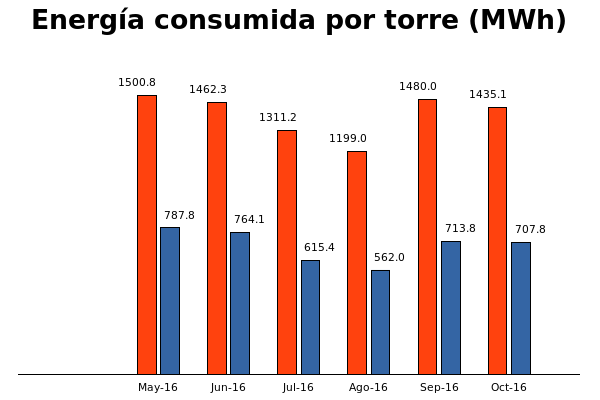
plot fuente using 2:xtic(1) ls 1 ti col axis x1y1, '' u 3 ls 2 ti col axis x1y2, '' u 0:2:2 with labels offset -3,1 , '' u 0:2:3 with labels offset 3,1我正在修改最后一行代码,因为这里是我设置标签的地方。我已经能够显示两个标签,但在不好的位置,我也能够显示一个标签在正确的位置,但没有另一个。除了我想要的东西,我几乎什么都能展示出来。这是生成脚本的图形。
output.png
这是我用来生成图形的源文件。
source.dat
"Momento" "Torre 1" "Torre 2"
"May-16" 1500.8 787.8
"Jun-16" 1462.3 764.1
"Jul-16" 1311.2 615.4
"Ago-16" 1199.0 562.0
"Sep-16" 1480.0 713.8
"Oct-16" 1435.1 707.8
这是我通过设置参数来执行的命令
gnuplot -e "titulo='Energía consumida por torre (MWh)'; salida='output.png'; fuente='source.dat'; color1='#FF420E'; color2='#3465A4'; limite1='1800.96'; limite2='945.36'" script.sh我想这是很明显的,我在假装,谁能帮我吗?
事先非常感谢。
回答 3
Stack Overflow用户
发布于 2016-11-08 16:56:49
您的脚本有几个问题,缺少的ti col只是其中之一。(您也可以使用set key auto columnheader,那么您不能每次都提供该选项)。
- 如果要比较值,请不要同时使用
y1和y2轴!否则,正确的酒吧高度只是运气的问题。 - 理解,如何定位柱状图条形图,然后你可以准确地定位每个条形的顶部中心。如果您只对
offset值使用char值(只给出数字时就是这种情况),那么一旦添加或删除数据行,脚本就会中断。
直方图簇从x位置0开始,并以整数x值为中心.由于每个集群中有两条,且间隙为1,第一条的中心位于($0 - 1/6.0) (= 1/(2 * (numberOfTorres + gapCount))),第二条位于($0 + 1/6.0)。
set terminal pngcairo nocrop enhanced size 600,400 font ",8"
set output 'output.png'
set title 'Energía consumida por torre (MWh)' font ",20"
set boxwidth 0.8 absolute
set border 1
set style fill solid 1.00 border lt -1
set style histogram clustered gap 1 title textcolor lt -1
set style data histograms
set xtics border scale 1,0 nomirror autojustify norangelimit
unset ytics

set key off auto columnheader
set yrange [0:*]
set offset 0,0,graph 0.05,0

set linetype 1 lc rgb '#FF420E'
set linetype 2 lc rgb '#3465A4'
# dx = 1/(2 * (numberOfTorres + gap))
dx = 1/6.0

plot 'source.dat' using 2:xtic(1),\
     '' u 3,\
     '' u ($0 - dx):2:2 with labels,\
     '' u ($0 + dx):3:3 with labels

现在,从酒吧中心开始,您可以安全地使用offset来指定相对于酒吧顶部中心的偏移量:
plot 'source.dat' using 2:xtic(1),\
         '' u 3,\
         '' u ($0 - dx):2:2 with labels offset -1,1 ,\
         '' u ($0 + dx):3:3 with labels offset 1,1
第二种选择是使用标签的对齐方式:红条的标签在右边边框右对齐,蓝色条的标签在左边框左对齐:
absoluteBoxwidth = 0.8
dx = 1/6.0 * (1 - absoluteBoxwidth)/2.0

plot 'source.dat' using 2:xtic(1),\
         '' u 3,\
         '' u ($0 - dx):2:2 with labels right offset 0,1 ,\
         '' u ($0 + dx):3:3 with labels left offset 0,1

在任何情况下,这两个选项都使您的脚本对输入数据的更改更加健壮。
Stack Overflow用户
发布于 2016-11-08 15:03:26
这看起来更好:
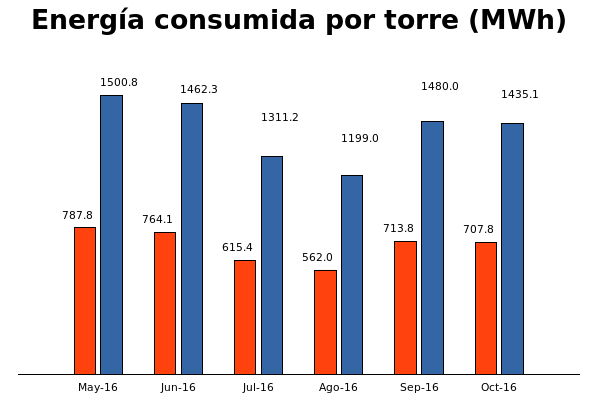
plot fuente using 3:xtic(1) ls 1 ti col axis x1y1, '' u 3 ls 2 ti col axis x1y2, '' u ($0-1):3:3 with labels offset -3,1 , '' u ($0-1):2:2 with labels offset 3,1您有两个情节命令:只显示第一个命令。另外,script.sh应该是一个bash脚本。这是一个gnuplot脚本,所以它应该有另一个扩展。
Stack Overflow用户
发布于 2016-11-08 15:40:37
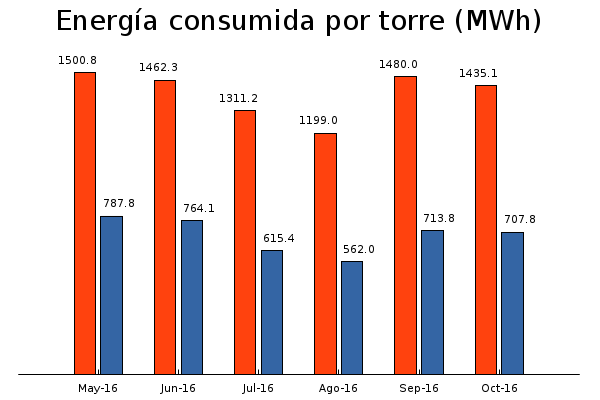
问题是ti col选项卡。你需要把它放在每一个选项,包括标签,而不只是在酒吧。正确的代码是:
plot fuente using 2:xtic(1) ls 1 ti col, '' u 3 ls 2 ti col, '' u 0:2:2 ti col with labels offset -3,1 , '' u 0:3:3 ti col with labels offset 3,1现在这张照片就是这样显示的:
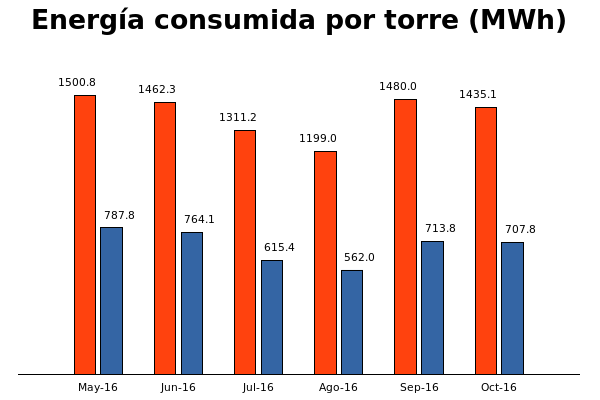
您还可以避免ti col,这就是它的外观:
https://stackoverflow.com/questions/40484582
复制相似问题
腾讯云开发者
