
从图像中自动选择方形斑点区域:计算机视觉
从图像中自动选择方形斑点区域:计算机视觉
提问于 2016-11-13 04:01:18
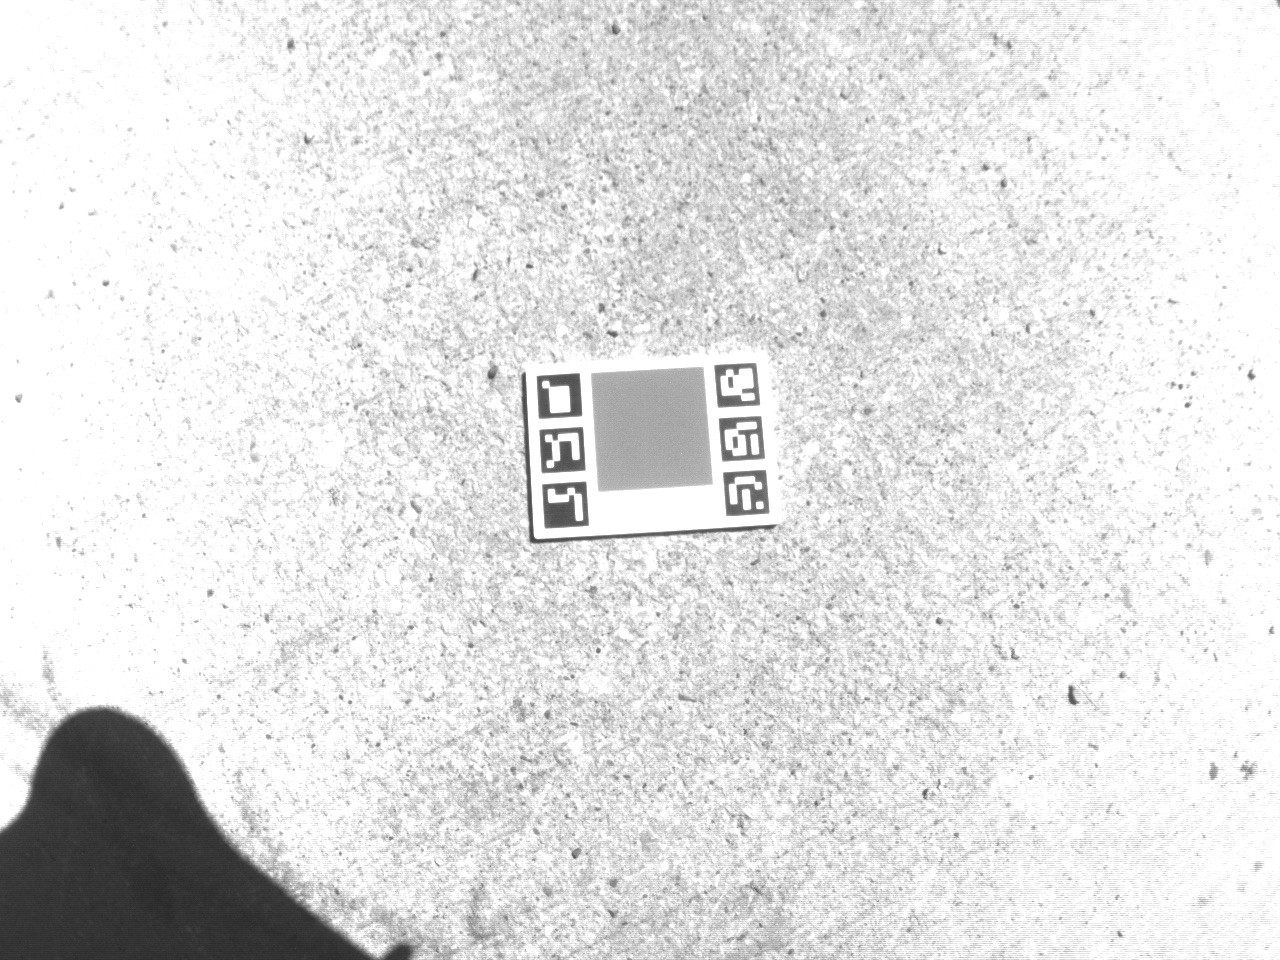
我正在尝试开发自动校准插件,我需要在图像中的中心blob的平均像素值。到目前为止,我正在将此图像转换为二进制图像,并能够识别图像中的不同斑点。
但是,我希望这个中心点能被识别出来。也许我们可以帮助周围的6个小斑点。
原始图像:https://drive.google.com/open?id=0B9kvfpiOcM1EWnhJeGtBZ3A4eTg
Matlab代码:
I = imread('BLOB.TIF');
Ibw = ~im2bw(I, 0.75);
Ifill = imfill(Ibw,'holes');
Iarea = bwareaopen(Ifill, 500);

stat = regionprops(Ifinal,'boundingbox');
imshow(I); hold on;
for cnt = 1 : numel(stat)
    bb = stat(cnt).BoundingBox;
    rectangle('position',bb,'edgecolor','r','linewidth',2);
endStack Overflow用户
发布于 2016-11-13 11:25:09
这是一个非常不恰当的问题。你和另一个答案都对你在自动校准过程中所拍摄的图像的性质做了非常具体的假设。既然没有明确的定义,我们就只能假设任何我们认为合理的东西。
例如,我的回答假设,在你拍摄的任何这样的图像中,最清晰的水平线是在你放置的物体上,或者是在顶部的阴影上,或者是物体背景和大正方形之间的线。它还假定中心大正方形的上线是在图像中找到的第二条最长的连续水平线(除了对象的底部边框,以及大方格的下线)。最后,我假设这个观点不会有太大的变化。
在每一步之后经常使用imagesc()来理解正在发生的事情,否则这个答案将花费50页。
% Normalize Image
image = double(BLOB);
image = (image - min(image(:)))*255/(max(image(:))-min(image(:)));

% Find Strong Horizontal Lines
Gy = imfilter(image,[-1 0 1]','replicate');
HH = abs(Gy)>prctile(abs(Gy(:)),95);

% Find the 10 Largest Lines
CC = bwconncomp(HH);
LengthList=sort(cellfun(@length,CC.PixelIdxList)','descend');
Lines = bwareaopen(HH,LengthList(10));
CC2 = bwconncomp(Lines);
这是线:
% Get Coordinates of Every Point in the 10 Largest Lines
[y x] = cellfun(@(X) ind2sub(size(Lines),X) ,CC2.PixelIdxList,'UniformOutput',false);

% Find Descriptive Parameters of Each Line
minx = cell2mat(cellfun(@min ,x,'UniformOutput',false))';
maxx = cell2mat(cellfun(@max ,x,'UniformOutput',false))';
miny = cell2mat(cellfun(@min ,y,'UniformOutput',false))';
maxy = cell2mat(cellfun(@max ,y,'UniformOutput',false))';
meanx = mean([minx maxx],2);

% Find the Horizontal Length of Each Line
LineLengths = maxx-minx;

% Find the Pair of 2 Second Largest Lines - The Top and Bottom Border of
% the Square
SecondLongestLineUpperBound = max(LineLengths)-0.2*max(LineLengths);
SecondLongestLineLowerBound = max(LineLengths)/3;
SquareBorderIndx = find(LineLengths>=SecondLongestLineLowerBound & LineLengths<=SecondLongestLineUpperBound);

% Make Sure First of the Pair is the Lower Line
[~,OrderedIndx] = sort(maxy(SquareBorderIndx));
SquareBorderIndx = SquareBorderIndx(OrderedIndx);

% Draw a Small Rectangle in the ROI and Get the ROI
DD =zeros(size(Lines));
DD(maxy(SquareBorderIndx(1)):miny(SquareBorderIndx(2)),meanx(SquareBorderIndx(1))-LineLengths(SquareBorderIndx(1))/5:meanx(SquareBorderIndx(2))+LineLengths(SquareBorderIndx(2))/5)=1;
ROI = double(BLOB).*DD;
这是ROI:
% Find Mean Intensity In the ROI
Result = mean(ROI(ROI(:)>0));Result =
4.3598e+04页面原文内容由Stack Overflow提供。腾讯云小微IT领域专用引擎提供翻译支持
原文链接:
https://stackoverflow.com/questions/40570432
复制相关文章
相似问题
腾讯云开发者
