
如何实时查看与所有从机相关的所有信息
如何实时查看与所有从机相关的所有信息
提问于 2016-12-21 10:12:27
我以这种方式配置了测试(在windows 7中):
- 1虚拟机是主服务器,它使用命令运行所有vm从站(来自命令行),并在j抄GUI中显示一些图形(例如jp@gc活动线程随时间、命中/秒、响应时间等)。
- 3虚拟机是从机,执行测试;
当主人运行“启动”到3个从线程时,测试工作正常(每个从线程运行6个线程),在主用户界面中,图中只有6个线程(jp@gc - Active thread),但实际上是18个线程(6个从线程,3个从线程)。
所以我的问题是:我如何才能看到所有奴隶的全部数据?
jp@gc -活动线程随着时间的推移=看到18个线程(线程slave1 +线程slave2+thread slave3) jp@gc -每秒命中1+命中从2+从3
等等..。
回答 2
Stack Overflow用户
回答已采纳
发布于 2016-12-21 14:31:13
您需要添加machineName或machineIP函数,以便侦听器能够区分来自不同节点的结果。
还要注意mode属性,该属性被配置为每100个结果或每分钟从从计算机发送结果(无论发生什么),因此您可能需要修改它,即在每个从节点上向user.properties文件添加mode=Standard行。
# Remote batching support
# Since JMeter 2.9, default is MODE_STRIPPED_BATCH, which returns samples in
# batch mode (every 100 samples or every minute by default)
# Note also that MODE_STRIPPED_BATCH strips response data from SampleResult, so if you need it change to
# another mode
# Hold retains samples until end of test (may need lots of memory)
# Batch returns samples in batches
# Statistical returns sample summary statistics
# hold_samples was originally defined as a separate property,
# but can now also be defined using mode=Hold
# mode can also be the class name of an implementation of org.apache.jmeter.samplers.SampleSender
#mode=Standard
#mode=Batch
#mode=Hold
#mode=Statistical有关使用Apache JMeter属性自定义指南属性的更多信息,请参见JMeter。
请注意,在负载严重的情况下发送结果可能会导致网络IO开销,因此考虑后端侦听器可能是个好主意。
Stack Overflow用户
发布于 2018-06-10 13:06:47
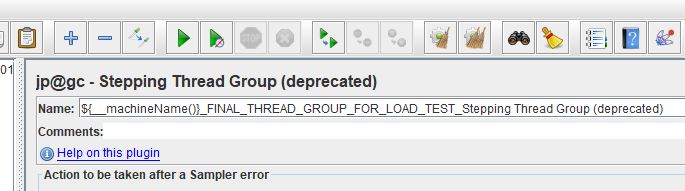
将Machine函数添加到线程组名称区域,如下所示:
页面原文内容由Stack Overflow提供。腾讯云小微IT领域专用引擎提供翻译支持
原文链接:
https://stackoverflow.com/questions/41260242
复制相关文章
相似问题
腾讯云开发者
