
标记文档中的get_map
以下代码
map<-get_map(location=params$chosenState, zoom=6,maptype='hybrid',source="google")
data<-sightings[sightings$State==params$chosenState, ]
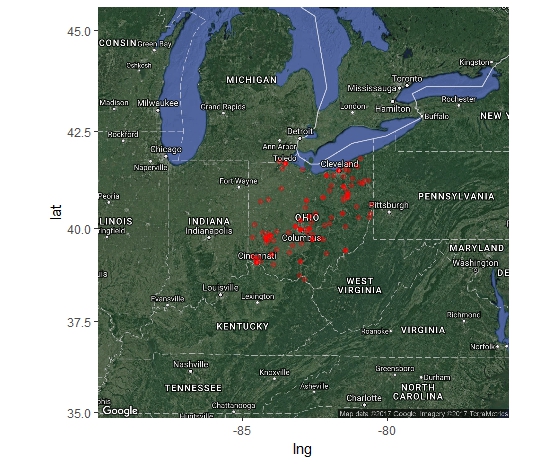
ggmap(map, base_layer=ggplot(aes(x=lng,y=lat),data=data)) +geom_point(color="red",alpha=0.3)只要我设置了一个名为params的数据,并将我的数据读取到一个名为观测的数据中,那么在控制台上工作就很好了。当参数$chosenState是"OH“时,它就会产生这样的情节。
但是,当我将所有内容移到Markdown文档中时
---
title: "UFOs"
output: html_document
params:
  chosenState: "OH"
---

```{r setup, include=FALSE}
Knitr::opts_chunk$set(回声=假)
图书馆(Ggmap)
图书馆(Ggplot2)
目击<- read.csv("UFOs_coord.csv",header=TRUE)
UFOPlot<-function(){
map<-get_map(location=params$chosenState,缩放= 6,maptype=‘混合型’,source="google")
data<-sightingssightings$State==params$chosenState,
ggmap(地图,base_layer=ggplot(x=lng,y=lat),data=data)
}
## UFO Sightings

Below is the locations of UFO sightings in  ``r params$chosenState``
```{r}
UFOPlot()
然后去编织,我得到了这个错误信息
错误的if (is.waive(数据)区)返回(cbind(数据,面板=整数(0)):缺失值,其中真/假需要调用:.应用-> f -> -> f
我想知道在Markdown中使用ggmap是否缺少一些基本的东西?这是我第一次尝试这么做。
下面是dataframe数据的开始
     Date...Time Country          City State    Shape      lat       lng
9   12/19/16 18:30     USA Huber Heights    OH Cylinder 39.85902 -84.11136
21  12/18/16 19:00     USA     Lancaster    OH    Light 39.71368 -82.59933
321 11/18/16 23:30     USA      Columbus    OH Cylinder 39.96226 -83.00071
326 11/18/16 19:15     USA   Stone Creek    OH Triangle 40.39729 -81.56206
327 11/18/16 18:30     USA    Carrollton    OH   Circle 40.57284 -81.08565
336 11/17/16 21:30     USA        Athens    OH    Light 39.32924 -82.10126
更新:
也许我的逻辑订阅出了什么问题?dplyr和Dhiraj建议的ggmap调用似乎就能做到这一点。这份文件编成得很好
---
title: "UFOs"
output: html_document
params:
  chosenState: "OH"
---

```{r setup, include=FALSE}
knitr::opts_chunk$set(echo = FALSE,message= FALSE,warning=FALSE)
图书馆(Ggmap)
图书馆(Ggplot2)
图书馆(Dplyr)
目击<- read.csv("UFOs_coord.csv",header=TRUE)
UFOPlot<-function(){
map<-get_map(location=params$chosenState,缩放= 6,maptype=‘混合型’,source="google")
数据<-目击%>% select(-Summary,-Shape) %>%过滤器(State==params$chosenState)
ggmap(地图)+ geom_point(data=data,aes(x=lng,y=lat),color="red",alpha=0.3)
}
## UFO Sightings

Below is the locations of UFO sightings in  ``r params$chosenState``
```{r}
UFOPlot()
回答 1
Stack Overflow用户
发布于 2017-03-13 04:37:52
我在rmarkdown文件中的代码块中尝试了以下内容,它似乎运行得很好:
library(ggmap)
lat <- 39.86+rnorm(10,0.5)
lng <- -82.59 + rnorm(10, 0.5)
sightings <- data.frame(cbind(lng,lat))

map<-get_map(location='Ohio', zoom = 6,maptype='hybrid',source="google")
ggmap(map) + geom_point(data=sightings, aes(x=lng,y=lat))https://stackoverflow.com/questions/42756389
复制相似问题
腾讯云开发者
