
具有可变采样率的周期数据平均
具有可变采样率的周期数据平均
提问于 2017-04-13 13:43:36
我有一个很长的[x,y]坐标值的玩具车运行轨道5-6圈。每圈数据点的数量不一致(圈数在50-60 [x,y]之间)。在Matlab中绘制的数据是有意义的,它绘制汽车在轨道上移动时的图形:
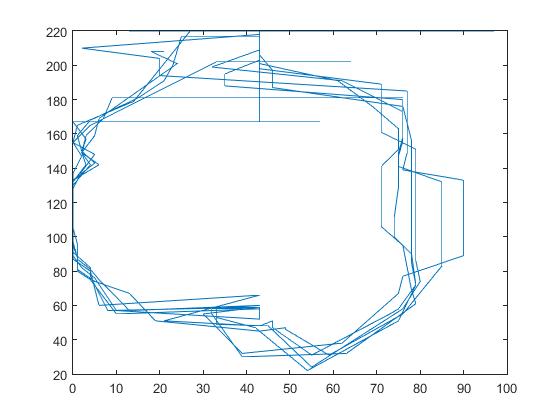
然而,我需要在某种程度上平均噪音圈,以创造一个更准确的单一地图的轨道。
我已经尝试标记开始的轨道,以确定一个新的圈开始,然后平均每个对应的点从每一圈,但由于不同数量的数据点为每一圈,这会导致更多的错误。
我考虑过对[x,y]数据进行排序,将所有的点连接到一个圈中,但这是不起作用的,因为轨道是循环的。
有没有人知道有一种方法可以将我的数据平均起来,合并到一起呢?
回答 1
Stack Overflow用户
回答已采纳
发布于 2017-04-13 14:16:18
一种方法是定义轨道的开始,然后通过路径的归一化弧长来参数化循环周围的每一次遍历。然后,您可以使用这种参数化在轨道上的特定间隔内插每条曲线,并对结果进行平均。
% Assume that the first point is the start point (t = 0)
start_point = path(1,:);
% Compute the distance to this point for all data points
distances = sqrt(sum(bsxfun(@minus, path, start_point).^2, 2));
% Find the minima of this curve (these are all the times that the car passed the start)
% We apply some smoothing to get rid of necessary noise. Really depends on your data
[~, locs] = findpeaks(smooth(-distances, 20));
% Make sure we include the first and last point
locs = [1; locs; numel(distances)];
% Desired samples for each loop
nSamples = 1000;
% Pre-allocate the outputs
xpoints = zeros(numel(locs) - 1, nSamples);
ypoints = zeros(numel(locs) - 1, nSamples);
for k = 1:(numel(locs) - 1)
% Get the coordinates recorded for this particular loop
loop_points = path(locs(k):locs(k+1),:);
% Compute the cumulative arc-length using these points
arc_length = cumsum([0; sum(diff(loop_points, [], 1).^2, 2)]);
% Normalize the arc_length between 0 and 1
arc_length = arc_length ./ arc_length(end);
% Interpolate along the curve
xpoints(k,:) = interp1(arc_length, loop_points(:,1), linspace(0, 1, nSamples));
ypoints(k,:) = interp1(arc_length, loop_points(:,2), linspace(0, 1, nSamples));
end
% Average all the x and y locations
X = mean(xpoints, 1);
Y = mean(ypoints, 1);
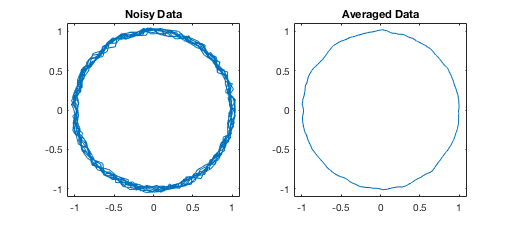
plot(X, Y)我们可以通过一个完美的圆来测试这一点,在每个电路中加入一些噪声,每次改变样本的数量。
nLoops = 10;

x = [];
y = [];

for k = 1:nLoops
    nSamples = randi([50, 70]);

    t = linspace(0, 2*pi, nSamples + 1);
    t(end) = [];

    x = cat(1, x(:), cos(t(:)) + 0.1 * (rand(size(t(:))) - 0.5));
    y = cat(1, y(:), sin(t(:)) + 0.1 * (rand(size(t(:))) - 0.5));
end

path = [x(:), y(:)];
注意:
findpeaks和smooth是工具箱函数,很可能被MATLAB中的函数替换。或者,如果您知道汽车已经通过起点,您可以完全删除findpeaks的使用。
页面原文内容由Stack Overflow提供。腾讯云小微IT领域专用引擎提供翻译支持
原文链接:
https://stackoverflow.com/questions/43393945
复制相关文章
相似问题
腾讯云开发者
