
用R绘制一个简单的网络图
用R绘制一个简单的网络图
提问于 2017-04-27 10:11:20
我有一个数据框架
mydf <- data.frame(ID = c(1,2,3,4,5), MatchedID = c(3,4,2,5,1), Weight = c(12,45,5,19,9))我希望绘制一个网络图,显示ID和matchedID之间的关系和权重作为这种关系的强度。用标签来表示这件事的最好方法是什么?我喜欢https://briatte.github.io/ggnet/的那些
回答 1
Stack Overflow用户
回答已采纳
发布于 2017-04-27 11:15:45
你可以试试:
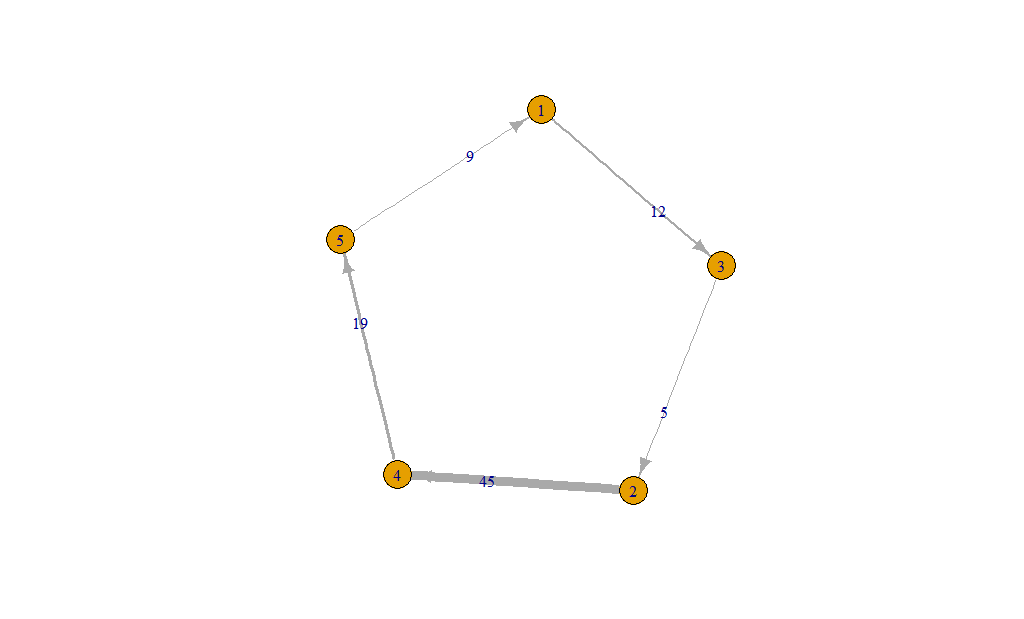
library(igraph)
g <- graph_from_data_frame(mydf, directed=TRUE)
g <- set_edge_attr(g, "weight", value = mydf$Weight)
plot(g, edge.width = E(g)$weight/5, edge.label=E(g)$weight)
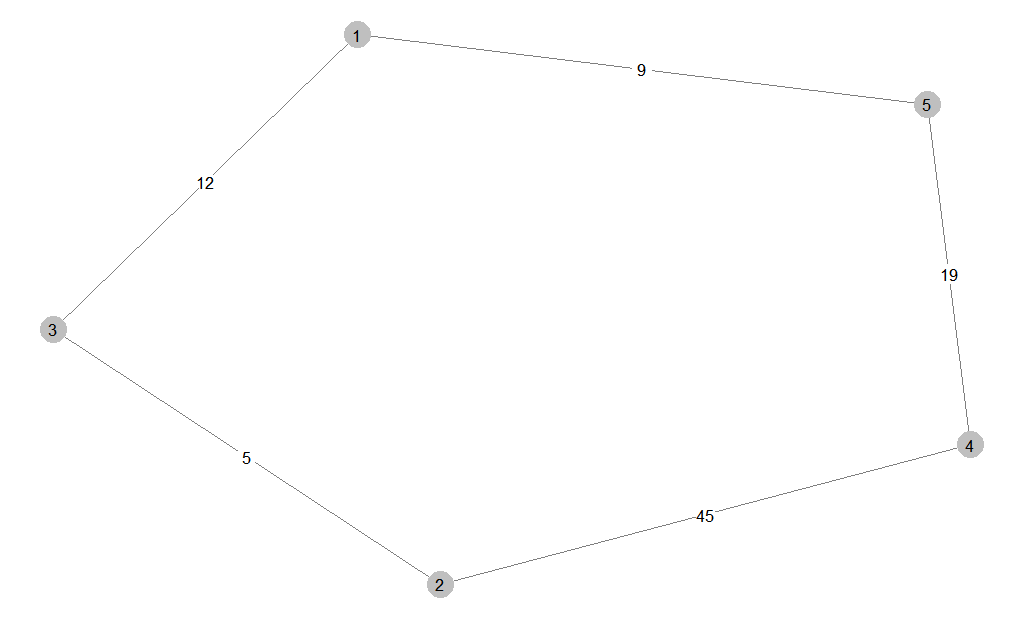
或者使用ggplot2
library(GGally)
library(sna)
library(network)
library(tidyverse)

mydf %>%
    spread(MatchedID, Weight, fill = 0) %>%
    select(-ID) %>%
    network(names.eval = "weights", ignore.eval = FALSE) %>%
    ggnet2(label = TRUE, edge.label = "weights")
页面原文内容由Stack Overflow提供。腾讯云小微IT领域专用引擎提供翻译支持
原文链接:
https://stackoverflow.com/questions/43654779
复制相关文章
相似问题
腾讯云开发者
