
如何在jupyter笔记本5中逐行剖析python 3.5代码
如何在jupyter笔记本5中逐行剖析python 3.5代码
提问于 2017-06-24 08:01:51
如何找出每一行python代码所占用的执行时间。
line_profiler适用于ipython,但不适用于jupyter笔记本。我尝试将@profile添加到我的函数中,它会出现错误,即名称'profile‘未定义。有一种方法可以通过time.time()来完成,但我想知道是否有内置的分析函数可以对我的函数的每一行进行分析并显示执行时间。
def prof_function():
    x=10*20
    y=10+x
return (y)回答 4
Stack Overflow用户
回答已采纳
发布于 2018-04-13 19:39:29
您可以在jupyter笔记本中使用line_profiler。
- 安装:
pip install line_profiler - 在你的jupyter笔记本里,打电话:
%load_ext line_profiler - 如示例中所示,定义函数
prof_function。 - 最后,概要如下:
%lprun -f prof_function prof_function()
它将提供产出:
Timer unit: 1e-06 s

Total time: 3e-06 s
File: <ipython-input-22-41854af628da>
Function: prof_function at line 1

Line #      Hits         Time  Per Hit   % Time  Line Contents
==============================================================
     1                                           def prof_function():
     2         1          1.0      1.0     33.3      x=10*20
     3         1          1.0      1.0     33.3      y=10+x
4 1 1.0 1.0 33.3 return (y)Stack Overflow用户
发布于 2018-09-22 23:46:49
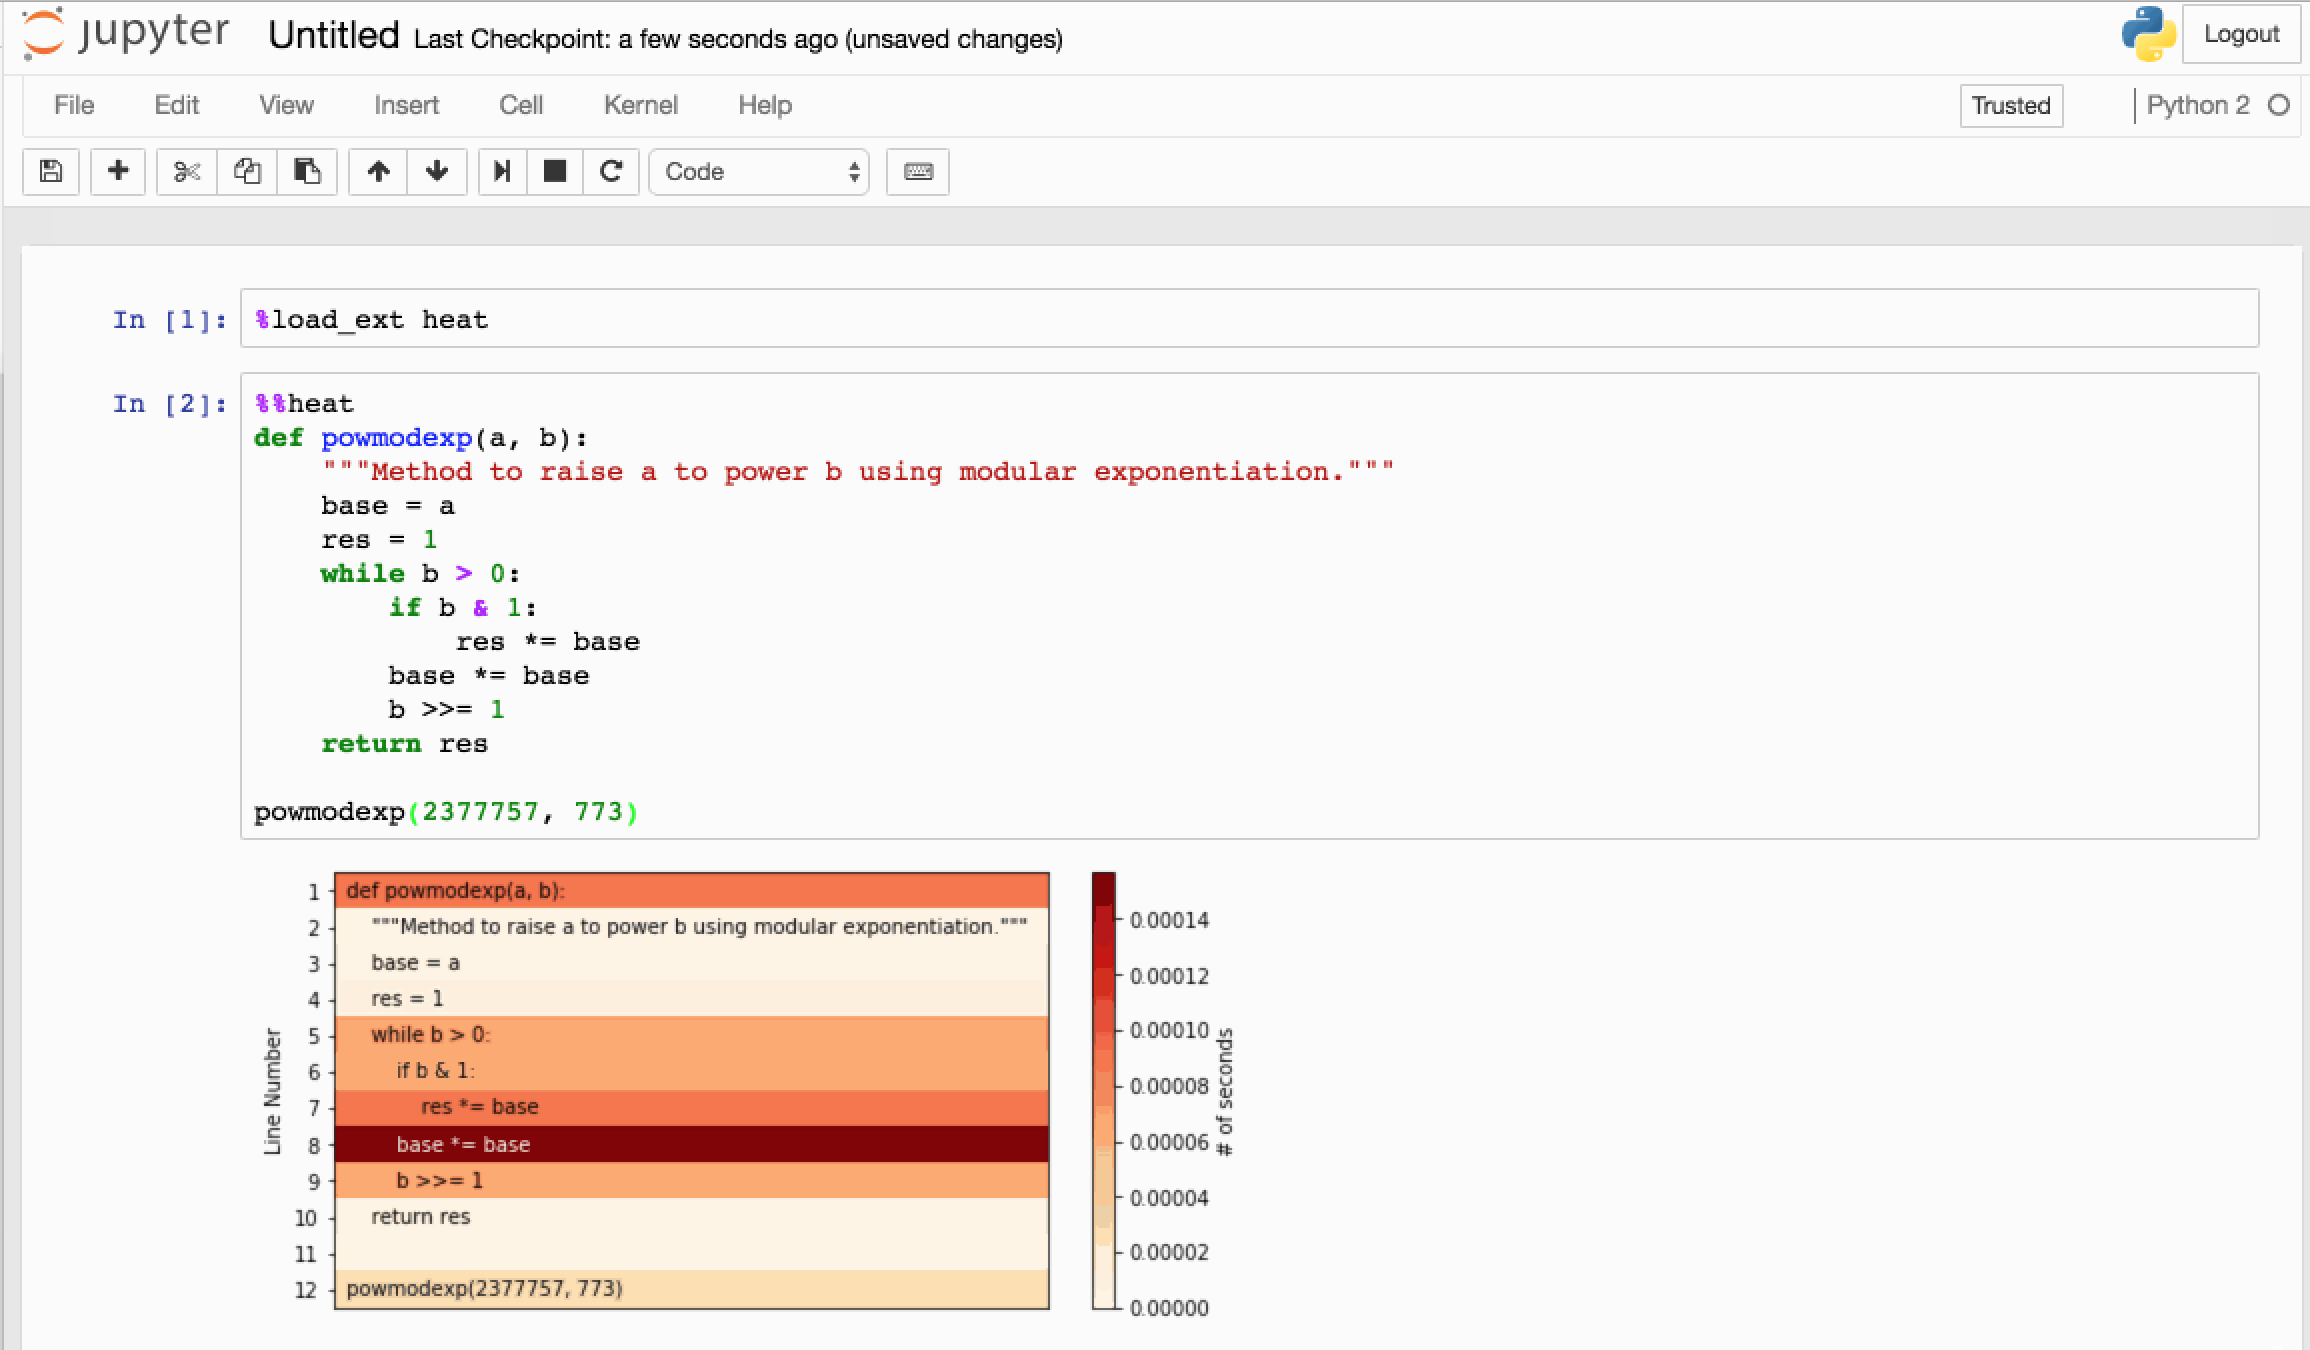
为了获得每一行的执行时间并得到一个漂亮的彩色编码热图,我使用了这个很好的ipython魔术.https://github.com/csurfer/pyheatmagic
安装:
pip安装py-热魔术
要详细描述笔记本中的每一行:
- 复制你的笔记本。
- 合并所有单元格(突出显示all和shift-m)
- 在顶部创建一个新的单元格
- 输入
%load_ext heat
在第二个单元格的顶部,在第一行输入以下内容:
%%heat 如果您有超过2000行代码,您可能会有问题。
Stack Overflow用户
发布于 2020-05-13 08:34:57
只是@S.A.答复的摘要
!pip install line_profiler
%load_ext line_profiler

def func():
    print('hi')

%lprun -f func func()页面原文内容由Stack Overflow提供。腾讯云小微IT领域专用引擎提供翻译支持
原文链接:
https://stackoverflow.com/questions/44734297
复制相关文章
相似问题
腾讯云开发者
