
R ggplot2盒图- ggpubr stat_compare_means不能正常工作
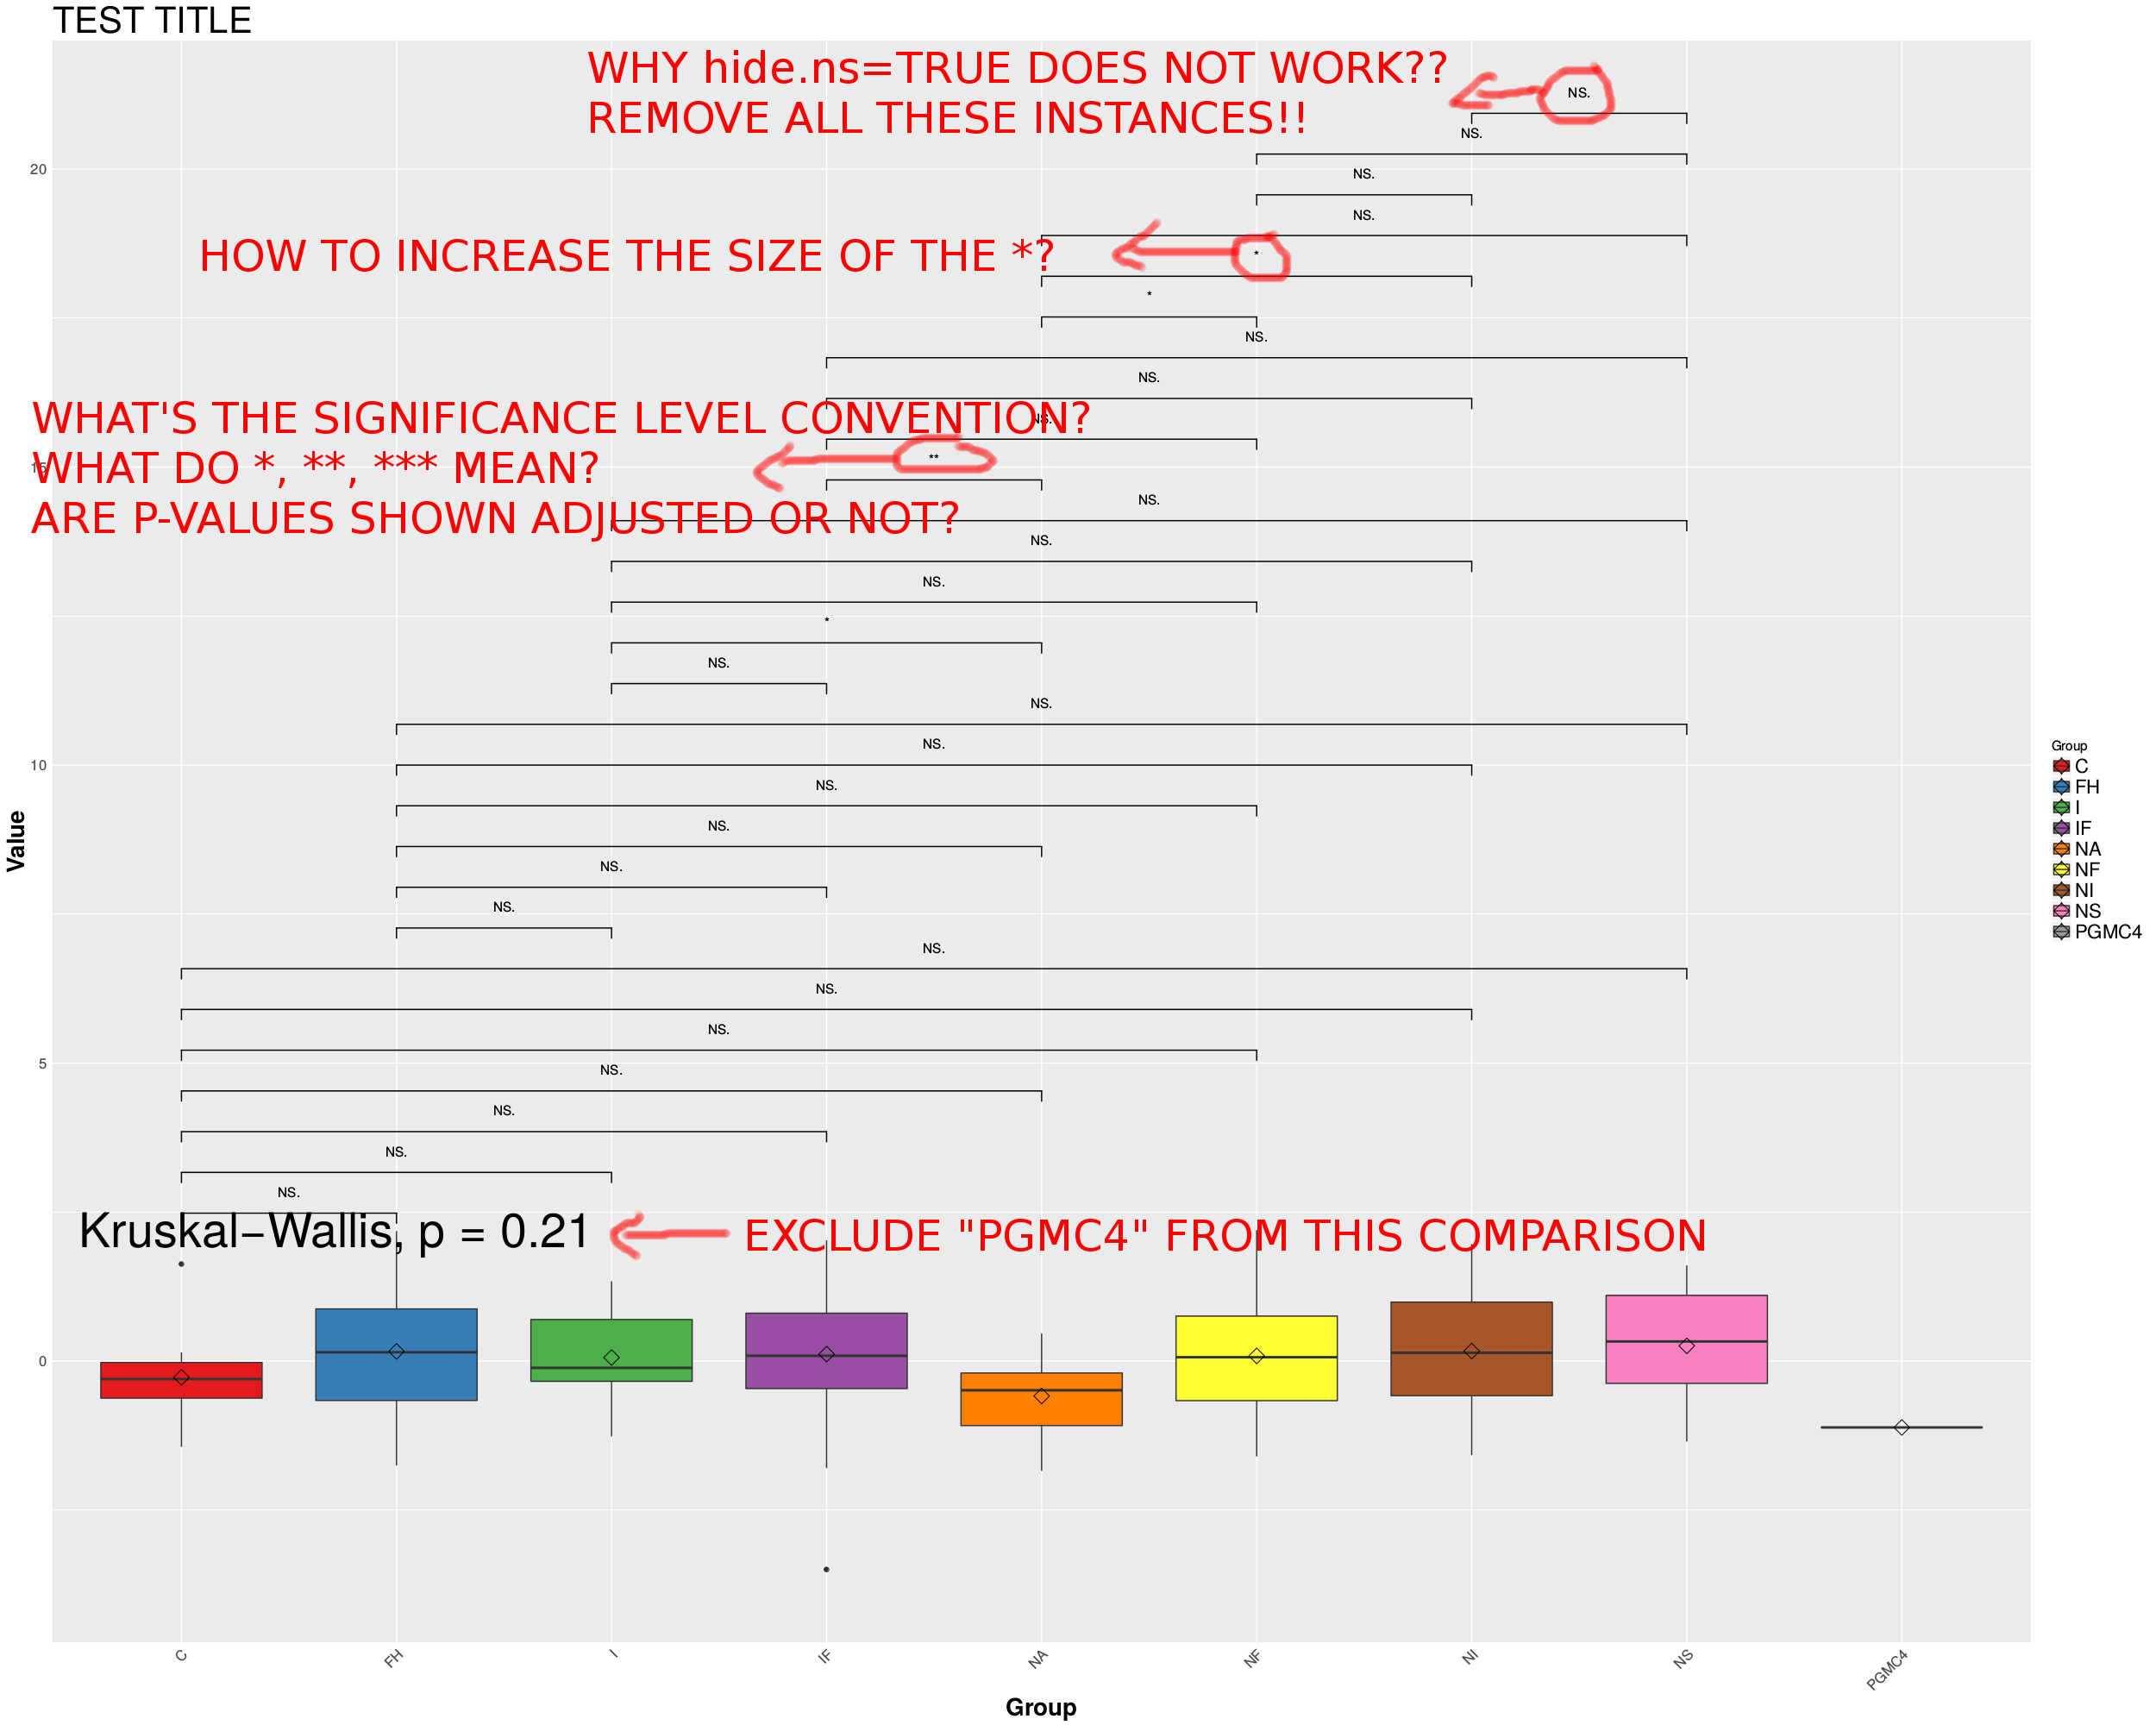
我试图使用ggplot2和ggpubr包以星号的形式向我的盒图添加显着性级别,但我有很多比较,我只想显示有意义的。
我尝试在stat_compare_means,中使用hide.ns=TRUE选项,但是显然不工作,它可能是ggpubr包中的一个bug。
此外,您还可以看到,在两两的kruskal.test wilcox.test比较中,我忽略了组"PGMC4“;我如何将这个组也排除在wilcox.test之外?
最后一个问题是,重要性水平是如何运作的?如*显著低于0.025.0 5,**低于0.025,*低于0.0 1?全球公共部门使用的惯例是什么?它是显示p值还是调整p值?如果是后者,调整的方法是什么?嗯?
##############################
##MWE
set.seed(5)
#test df
mydf <- data.frame(ID=paste(sample(LETTERS, 163, replace=TRUE), sample(1:1000, 163, replace=FALSE), sep=''),
                   Group=c(rep('C',10),rep('FH',10),rep('I',19),rep('IF',42),rep('NA',14),rep('NF',42),rep('NI',15),rep('NS',10),rep('PGMC4',1)),
                   Value=rnorm(n=163))
#I don't want to compare PGMC4 cause I have only onw sample
groups <- as.character(unique(mydf$Group[which(mydf$Group!="PGMC4")]))
#function to make combinations of groups without repeating pairs, and avoiding self-combinations
expand.grid.unique <- function(x, y, include.equals=FALSE){
    x <- unique(x)
    y <- unique(y)
    g <- function(i){
        z <- setdiff(y, x[seq_len(i-include.equals)])
        if(length(z)) cbind(x[i], z, deparse.level=0)
    }
    do.call(rbind, lapply(seq_along(x), g))
}
#all pairs I want to compare
combs <- as.data.frame(expand.grid.unique(groups, groups), stringsAsFactors=FALSE)
head(combs)
my.comps <- as.data.frame(t(combs), stringsAsFactors=FALSE)
colnames(my.comps) <- NULL
rownames(my.comps) <- NULL
#pairs I want to compare in list format for stat_compare_means
my.comps <- as.list(my.comps)
head(my.comps)
pdf(file="test.pdf", height=20, width=25)
print(#or ggsave()
  ggplot(mydf, aes(x=Group, y=Value, fill=Group)) + geom_boxplot() +
    stat_summary(fun.y=mean, geom="point", shape=5, size=4) +
    scale_fill_manual(values=myPal) +
    ggtitle("TEST TITLE") +
    theme(plot.title = element_text(size=30),
      axis.text=element_text(size=12),
      axis.text.x = element_text(angle=45, hjust=1),
      axis.ticks = element_blank(),
      axis.title=element_text(size=20,face="bold"),
      legend.text=element_text(size=16)) +
  stat_compare_means(comparisons=my.comps, method="wilcox.test", label="p.signif", size=14) + #WHY DOES hide.ns=TRUE NOT WORK??? WHY DOES size=14 NOT WORK???
  stat_compare_means(method="kruskal.test", size=14) #GLOBAL COMPARISON ACROSS GROUPS (HOW TO LEAVE PGMC4 OUT OF THIS??)
)
dev.off()
##############################
妇女权利和平等部将制作以下方框:
问题是:
1-如何使hide.ns=TRUE工作?
2-如何扩大*
3-如何将一个组排除在kruskal.test比较之外?
4-由ggpubr使用的*约定是什么,并且p值是否被调整?
非常感谢!!
编辑
另外,做的时候
stat_compare_means(comparisons=my.comps, method="wilcox.test", p.adjust.method="BH")我获得的p值与
wilcox.test(Value ~ Group, data=mydf.sub)$p.value其中,对于给定的2组比较,mydf.sub是mydf的子集()。
在这里做什么?它如何计算p.values?
编辑2
请帮助,解决方案不需要使用ggpubr (但必须使用ggplot2),我只需要能够隐藏NS并使星号的大小更大,以及与wilcox.test() +p.adjust(方法“BH”)相同的p值计算。
谢谢!
回答 1
Stack Overflow用户
发布于 2017-08-07 07:21:22
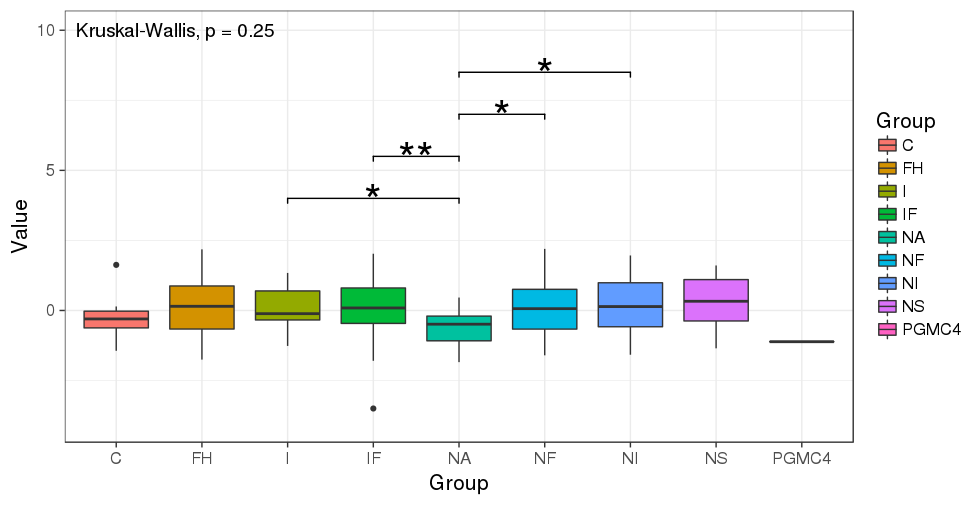
编辑:自从我发现了rstatix包之后,我会这样做:
set.seed(123)
#test df
mydf <- data.frame(ID=paste(sample(LETTERS, 163, replace=TRUE), sample(1:1000, 163, replace=FALSE), sep=''),
                   Group=c(rep('C',10),rep('FH',10),rep('I',19),rep('IF',42),rep('NA',14),rep('NF',42),rep('NI',15),rep('NS',10),rep('PGMC4',1)),
                   Value=c(runif(n=100), runif(63,max= 0.5)))


library(tidyverse)

stat_pvalue <- mydf %>%
 rstatix::wilcox_test(Value ~ Group) %>%
 filter(p < 0.05) %>%
 rstatix::add_significance("p") %>%
 rstatix::add_y_position() %>%
 mutate(y.position = seq(min(y.position), max(y.position),length.out = n())

ggplot(mydf, aes(x=Group, y=Value)) + geom_boxplot() +
  ggpubr::stat_pvalue_manual(stat_pvalue, label = "p.signif") +
  theme_bw(base_size = 16)
旧的答案:
你可以试着跟着。这样做的想法是,使用pairwise.wilcox.test计算自己的统计数据。然后使用ggsignif函数geom_signif添加预计算的p值。使用y_position,您可以放置括号,这样它们就不会重叠。
library(tidyverse)
library(ggsignif)
library(broom)
# your list of combinations you want to compare
CN <- combn(levels(mydf$Group)[-9], 2, simplify = FALSE)
# the pvalues. I use broom and tidy to get a nice formatted dataframe. Note, I turned off the adjustment of the pvalues.
pv <- tidy(with(mydf[ mydf$Group != "PGMC4", ], pairwise.wilcox.test(Value, Group, p.adjust.method = "none")))
#  data preparation
CN2 <- do.call(rbind.data.frame, CN)
colnames(CN2) <- colnames(pv)[-3]
# subset the pvalues, by merging the CN list
pv_final <- merge(CN2, pv, by.x = c("group2", "group1"), by.y = c("group1", "group2"))
# fix ordering
pv_final <- pv_final[order(pv_final$group1), ]
# set signif level
pv_final$map_signif <- ifelse(pv_final$p.value > 0.05, "", ifelse(pv_final$p.value > 0.01,"*", "**"))

# the plot
ggplot(mydf, aes(x=Group, y=Value, fill=Group)) + geom_boxplot() +
  stat_compare_means(data=mydf[ mydf$Group != "PGMC4", ], aes(x=Group, y=Value, fill=Group), size=5) +
  ylim(-4,30)+
  geom_signif(comparisons=CN,
              y_position = 3:30, annotation= pv_final$map_signif) +
  theme_bw(base_size = 16)
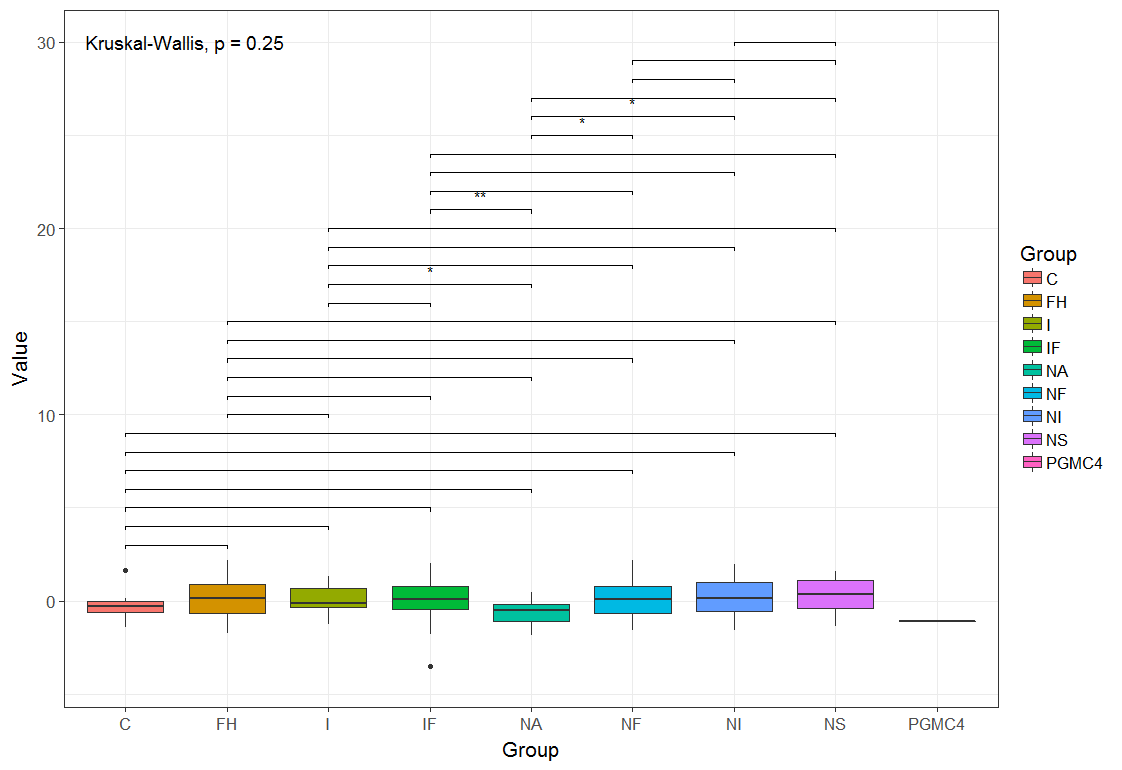
参数vjust、textsize和size不能正常工作。似乎是最新版本的ggsignif_0.3.0中的一个bug。
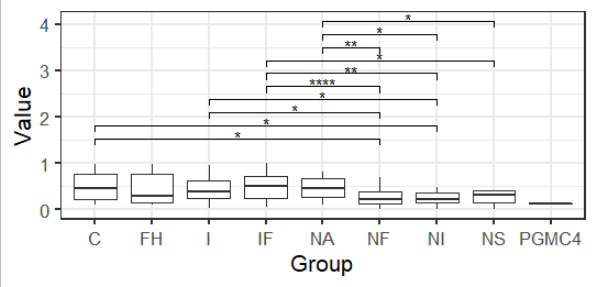
编辑:当您只想显示重要的比较时,您可以很容易地将dataset CN子集。自从我更新到ggsignif_0.4.0和R version 3.4.1之后,vjust和textsize就如出一辙了。而不是y_position,您可以尝试step_increase。
# subset
gr <- pv_final$p.value <= 0.05
CN[gr]

ggplot(mydf, aes(x=Group, y=Value, fill=Group)) +
  geom_boxplot() +
  stat_compare_means(data=mydf[ mydf$Group != "PGMC4", ], aes(x=Group, y=Value, fill=Group), size=5) +
  geom_signif(comparisons=CN[gr], textsize = 12, vjust = 0.7,
             step_increase=0.12, annotation= pv_final$map_signif[gr]) +
  theme_bw(base_size = 16)
你也可以使用ggpubr。添加:
stat_compare_means(comparisons=CN[gr], method="wilcox.test", label="p.signif", color="red")
https://stackoverflow.com/questions/45476950
复制相似问题
腾讯云开发者
